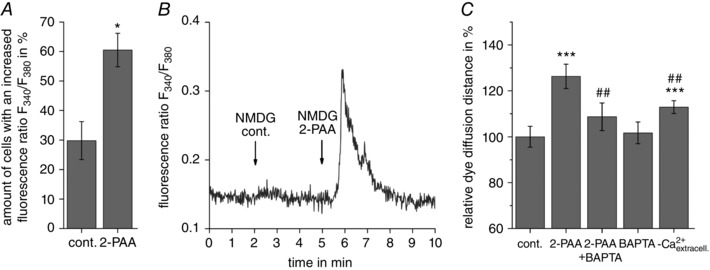
Figure 6. The 2‐PAA‐induced increase in gap junction coupling was Ca2+ dependent.

A, application of 2‐PAA (20 μm) increased the intracellular Ca2+ signal (fluorescence ratio F 340/F 380). The columns show the results obtained by counting the amount of cells with an increased [Ca2+]i after treatment with the vehicle control (cont., 0.3% ethanol) or 2‐PAA (20 μm) in presence of 140 mm external Na+. B, a representative rapid transient Ca2+ signal induced by application of 2‐PAA (20 μm) when external Na+ was replaced by NMDG. C, the 2‐PAA‐induced increase in the dye diffusion distance was abolished when 2‐PAA (20 μm, 1 h) was applied on cells preloaded with the Ca2+ chelator BAPTA (10 μm) or in absence of external Ca2+ (‐ Ca2+ extracell.). All results were analysed using Student's t test. *Significant differences to the vehicle control: * P < 0.05: *** P < 0.001; #significant differences to 2‐PAA: ## P < 0.01.
