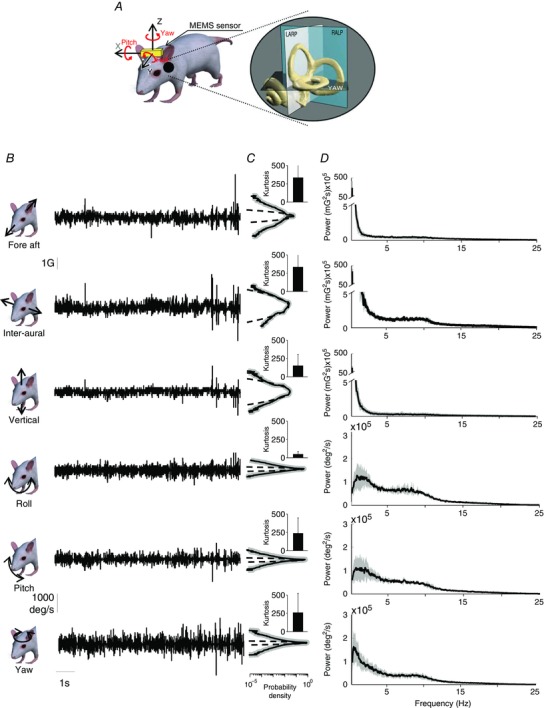
Figure 1. Statistics of mouse natural vestibular stimuli.

A, representation of a mouse with the MEMS module (gold box). The inset shows a magnified image of the vestibular sensors and the corresponding semi‐circular canal planes. B, a 10 s example of fore–aft acceleration (first row), inter‐aural linear acceleration (second row), vertical linear acceleration (third row), LARP angular velocity (Roll, fourth row), RALP angular velocity (Pitch, fifth row) and yaw angular velocity (sixth row) signals during different everyday activities. C, population‐averaged probability distributions for these signals (continuous black lines) with corresponding standard deviation (shaded areas) and best Gaussian fit (dashed lines). Inset: population‐averaged excess kurtosis values. D, population‐averaged power spectra (black) of these signals with corresponding standard deviations (dark grey bands).
