
Figure 9. Gene networks for DMRs with differential DNA methylation between the LG‐IH and LG‐SF groups.
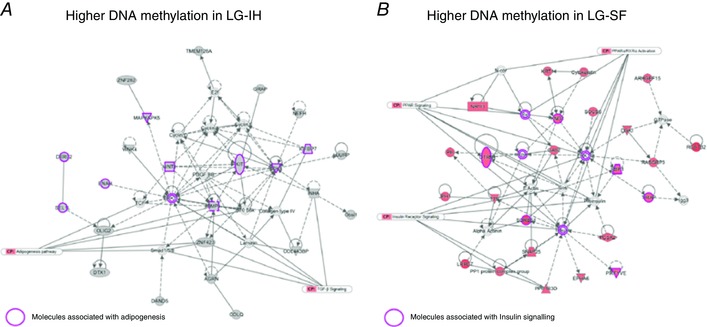
A, DMRs with higher methylation in the LG‐IH group; B, DMRs with higher methylation in the LG‐SF group. Gene networks were built as indicated in Fig. 7. Purple shapes indicate molecules associated with adipogenesis and insulin signalling in A and B, respectively.