
Figure 10. Expression analysis of the Pparg locus.
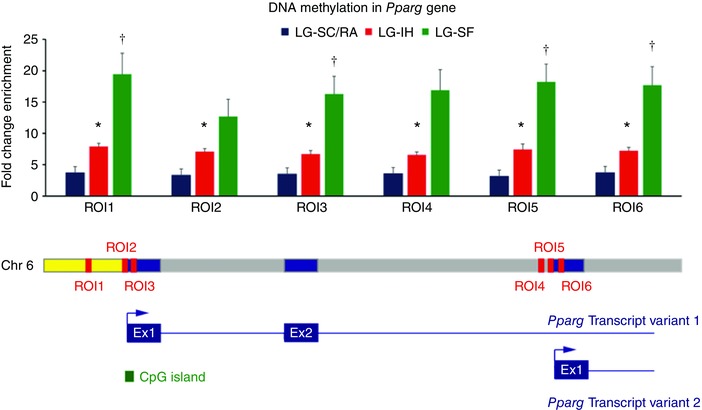
Single locus MeDIP‐qPCR results for the Pparg locus in VWAT samples in LG‐IH (red bars), LG‐SF (green bars) and LG‐RA/SC (blue bars) groups in candidate regions (ROI1–6). Fold change enrichment (FCE) values are shown in the y‐axis as the mean. Error bars corresponds to SEM. * P < 0.05, t test between the LG‐IH and LG‐RA/SC groups. † P > 0.05, t test between the LG‐SF and LG‐RA/SC groups. Lower panel depicts the position of the six ROIs in the Pparg locus in chromosome 6 and the two transcript variants. Exons, introns and the 5′‐UTR are represented as blue, grey and yellow boxes. ROI positions are marked in red. A CpG island associated with the 5′‐UTR is shown in green.