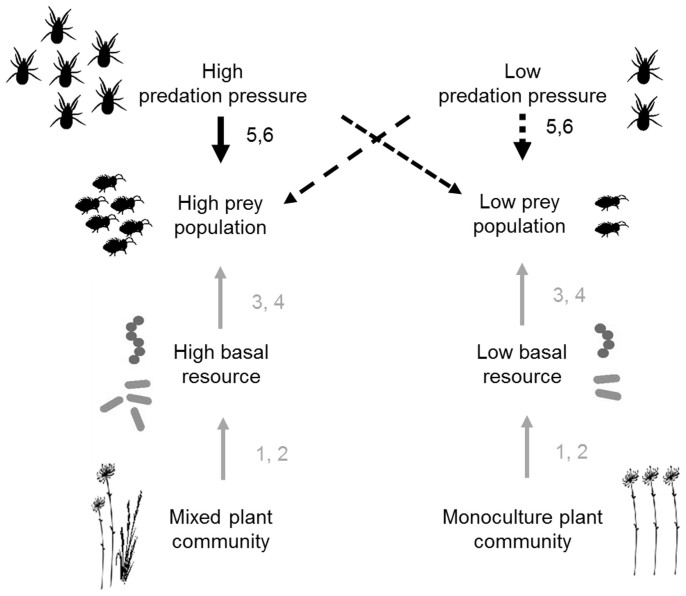
Figure 1. Conceptual diagram illustrating the working hypotheses.
The basal resource in this study is soil microbial biomass C. The upward directing gray arrows with numbers indicate literature-based information for the shown relation. For instance, mixed plant communities have been shown to be associated with higher soil microbial biomass C (Reference 1). The downward directing arrows indicate hypotheses on differences in the strength of top-down control at high vs. low predator densities in two plant community composition scenarios (mixed and monocultures). The dashed arrows indicate weak top-down control, whereas solid arrows indicate strong top-down control. The crossed dashed arrows indicate weak top-down control as predators at high density will not thrive in the presence of low prey density, and low predator densities cannot suppress high densities of prey (see text for details). Figure is drawn by MPT. References: 1 - Spehn et al. 200023; 2 - Eisenhauer et al. 201324; 3 - Bonkowski et al. 200012; 4 - Scheu et al. 200513; 5 - Oksanen et al. 19818; 6 - Haddad et al. 20117.

