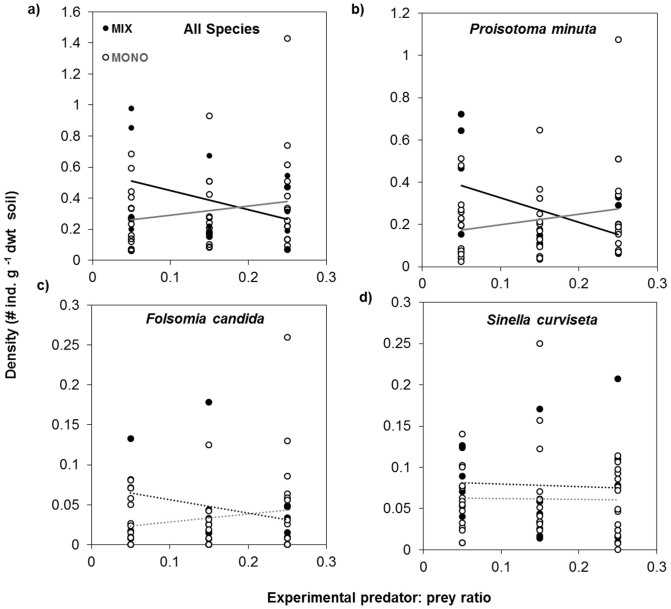
Figure 2.
(a) Total Collembola densities, (b) densities of Proisotoma minuta, (c) densities of Folsomia candida, and (d) densities of Sinella curviseta at the end of the experiment as affected by experimental predator densities (indicated by predator: prey ratio) and plant community composition. The black solid lines show significant relationships, whereas dotted lines indicate non-significant relationships.

