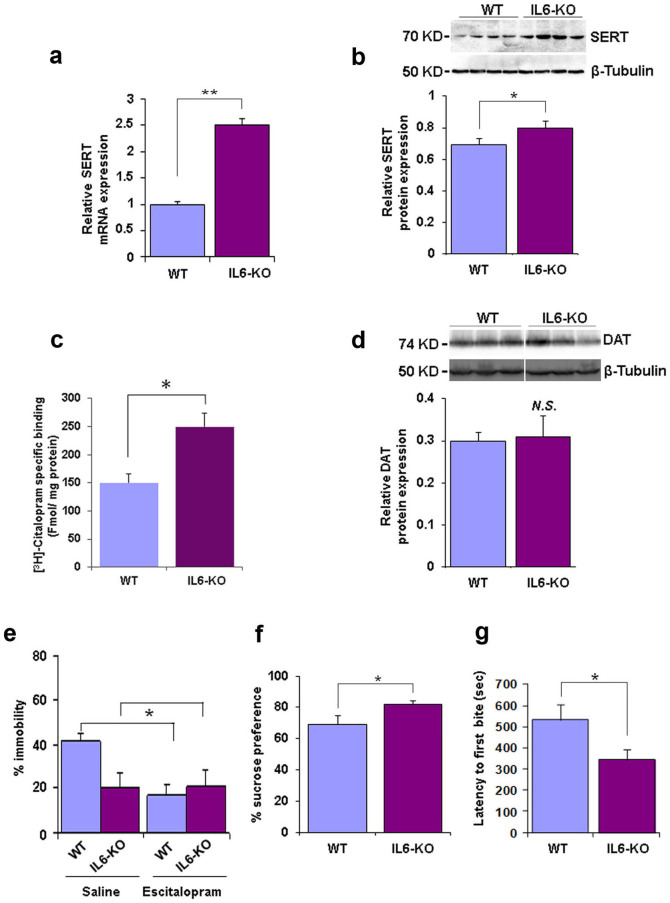
Figure 2. SERT expression and depression-like behavior in IL6-KO mice.
(a) SERT raphe nuclei mRNA levels (qRT-PCR) (p = 0.0032; t(7) = 3.984; n = 4 per group), (b) SERT hippocampal protein (p = 0.0231; t(7) = 3.236; n = 4 per group), (c) radioligand binding assays with the selective SERT ligand [3H]citalopram (2 nm) on synaptosomal membranes prepared from cortical tissue (p = 0.010; t(17) = 2.885; n = 8–10 per group) and (d) DAT striatal protein levels (p = 0.1428; t(7) = 1.737; n = 4 group) in wild type (WT) and IL6-KO mice. The blots are each representative of four independent experiments and blot images were cropped for comparison (e) Percentage of time spent immobile and response to acute injection of Escitalopram (and saline control) in the Forced Swim Test (main effect of strain F(2,17) = 4.99, p = 0.0423, main effect of treatment F(2,17) = 4.52, p = 0.0523, strain x treatment interaction F(2,17) = 9.41, p = 0.0083; n = 4 to 5 per group), (f) relative sucrose preference in the Sucrose Preference Test (p = 0.0461, t(17) = 2.151, n = 9 to 10 per group) and (g) latency to feed in the Novelty Suppressed Feeding test (p = 0.0134, t(17) = 2.76, n = 9 to 10 per group). Data are depicted as mean +/− SEM. N.S. not significant, * p < 0.05, ** p < 0.01.

