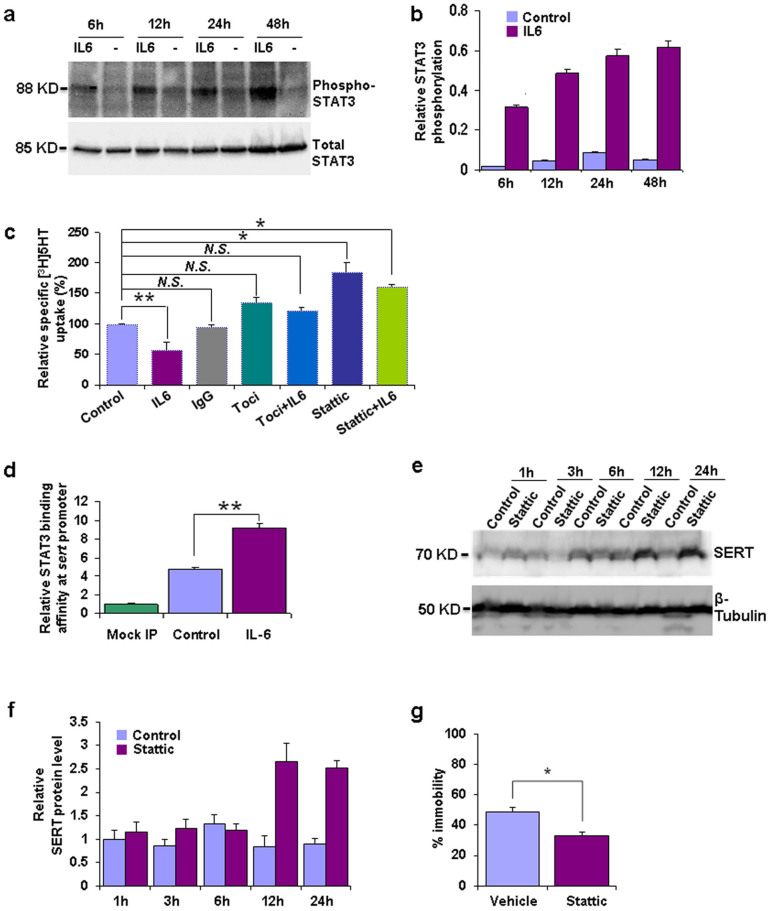
Figure 3. STAT3 controls SERT expression and function and modulates depression-like behavior.
Time course of phospho-STAT3 and total STAT3 protein levels (Western Blot) in untreated control (−) and IL6 treated (IL6) JAR cells: (a) Western Blot image representative of three independent experiments with blot images cropped for comparison and (b) result of quantification (main effect of time F(2,23) = 226.98, p = 0.0001, main effect of treatment F(2,23) = 1796.69, p = 0.0001, time x treatment interaction F(2,23) = 62.55, p = 0.0001; n = 3 per group). (c) Specific cellular [3H]5-HT uptake of JAR cells after 48 h of incubation with IL6, IgG1, tocilizumab (Toci), Stattic or combinations thereof and in untreated controls respectively. Relative specific [3H]5HT uptake values were quantified by the ratio of individual specific uptake values against that of control (p = 0.008, F(6,22) = 7.17; n = 3–4 per group). (d) Chromatin immunoprecipitation (ChIP) analysis of STAT3 binding to the SERT promoter in untreated (control) and IL6 treated JAR cells (p = 0.0001, t(9) = 6.767, n = 6 per group). Time course of SERT hippocampal protein levels (Western Blot) of vehicle control and Stattic treated mice: (e) Western Blot image representative of three independent experiments with blot images cropped for comparison and (f) result of quantification (main effect of time F(1,29) = 242.41, p = 0.0001, main effect of treatment F(4,29) = 1496.39, p = 0.0001, time x treatment interaction F(4,29) = 416.50, p = 0.0001; n = 3 per group). (g) Percentage of time spent immobile in the Forced Swim Test in vehicle control and Stattic treated mice 24 hrs after i.p. injection (p = 0.0028, t(7) = 4.487, n = 4 to 5 per group). Data are depicted as mean +/− SEM. N.S. not significant, * p < 0.05, ** p < 0.01; results of post-hoc pairwise comparisons are indicated in (c).

