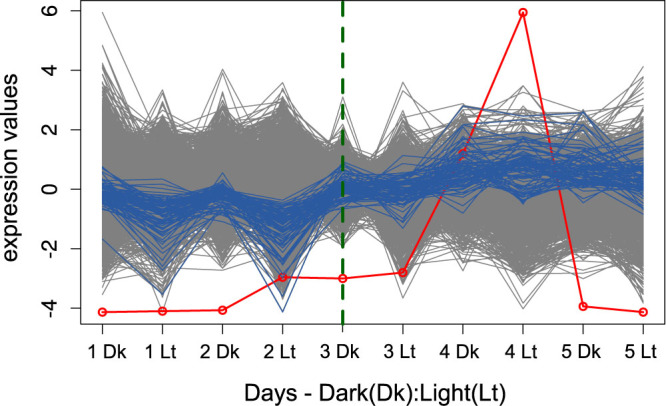
Figure 3. Segmentation over diel growth state transition of diatom Thalassiosira pseudonana.

The expression profile of 5417 genes illustrated over cycles of 12:12 h dark(Dk):light(Lt) in 5 days. The green dashed line shows the obtained breakpoint. The blue colored curves illustrate the key components within the first segment which led to the only structural changes at [3 Dk]. The gray colored parts of the time-series denote the variables that were not involve in the local changes at the corresponding breakpoints, as detected by the approach. The red dots, connected by a red line, represent the sequence A (column-averages of the absolute values of the regression coefficients in the matrix C).
