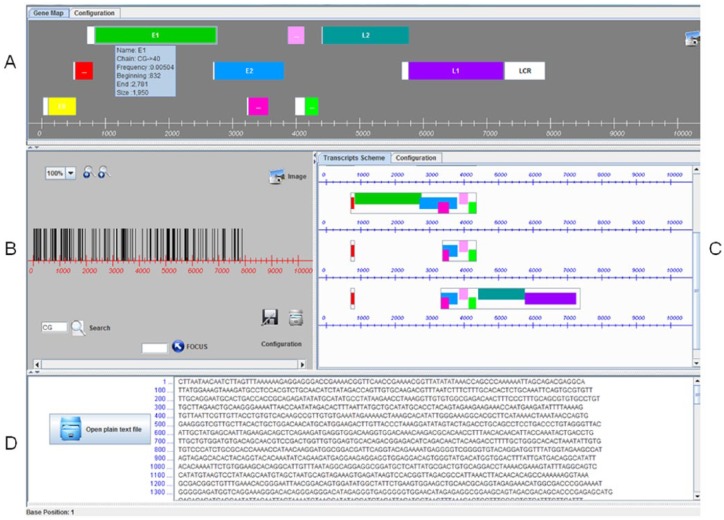
Figure 1.
PISMA graphical user interface. Panel A: Motif distribution on user-defined genomic regions, as a gene-map–like view. Panel B: Motif distribution on the complete genomic sequence, as a bar-code–like view. Panel C: Motif distribution on user-defined genomic regions, as a transcripts scheme. Panel D: Plain text DNA sequence.

