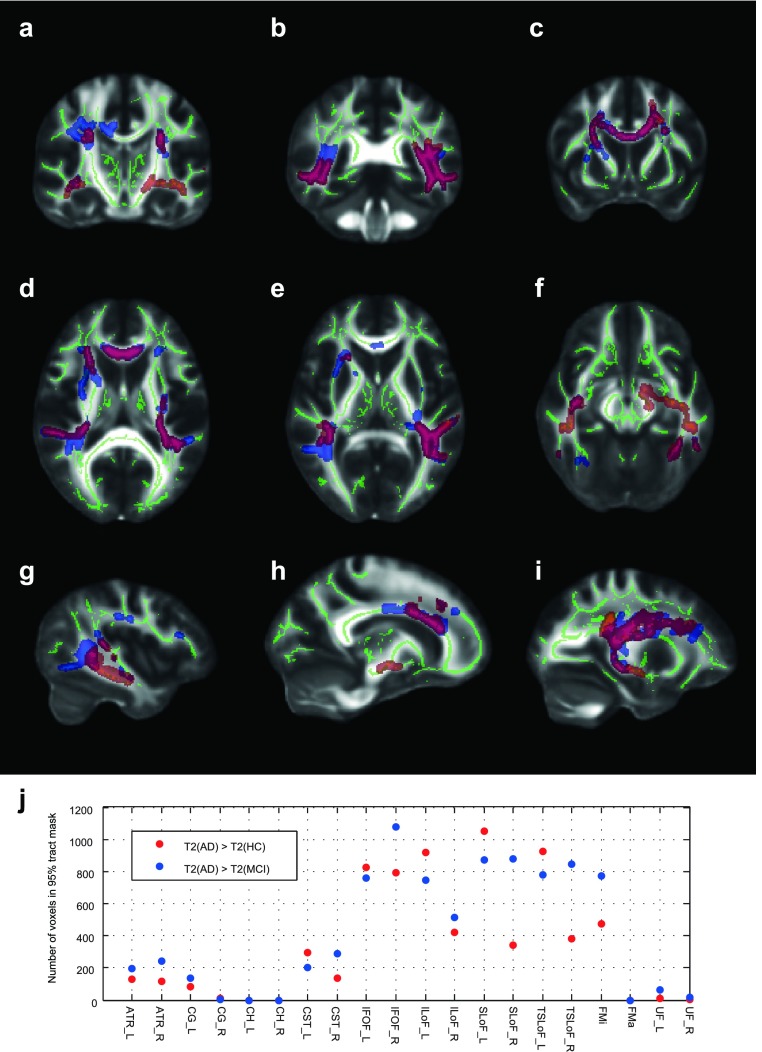
Figure 2.
Changes in WM T2 identified by TBSS. Panels (a)–(i) show example slices demonstrating regions in which T2 could distinguish groups. The ‘FA skeleton’, identified from DTI data, is shown in green. Clusters identified by threshold-free cluster-enhancement (TFCE) confidently distinguishing groups at the 95% confidence level are shown with the following colours: red/yellow: T2(AD) > T2(NC); blue/light blue: T2(AD) > T2(MCI); purple/light green: T2(AD) > T2(HC) and T2(AD) > T2(MCI). Data are shown on the FMRIB58_FA standard FA template. Note that the FOV in T2 mapping was spatially limited to what is shown in figure 1. Panel (j) shows the number of voxels in all WM tracts of the JHU WM tractography atlas for which the TBSS analysis, using T2, could separate AD from HC or AD from MCI.

