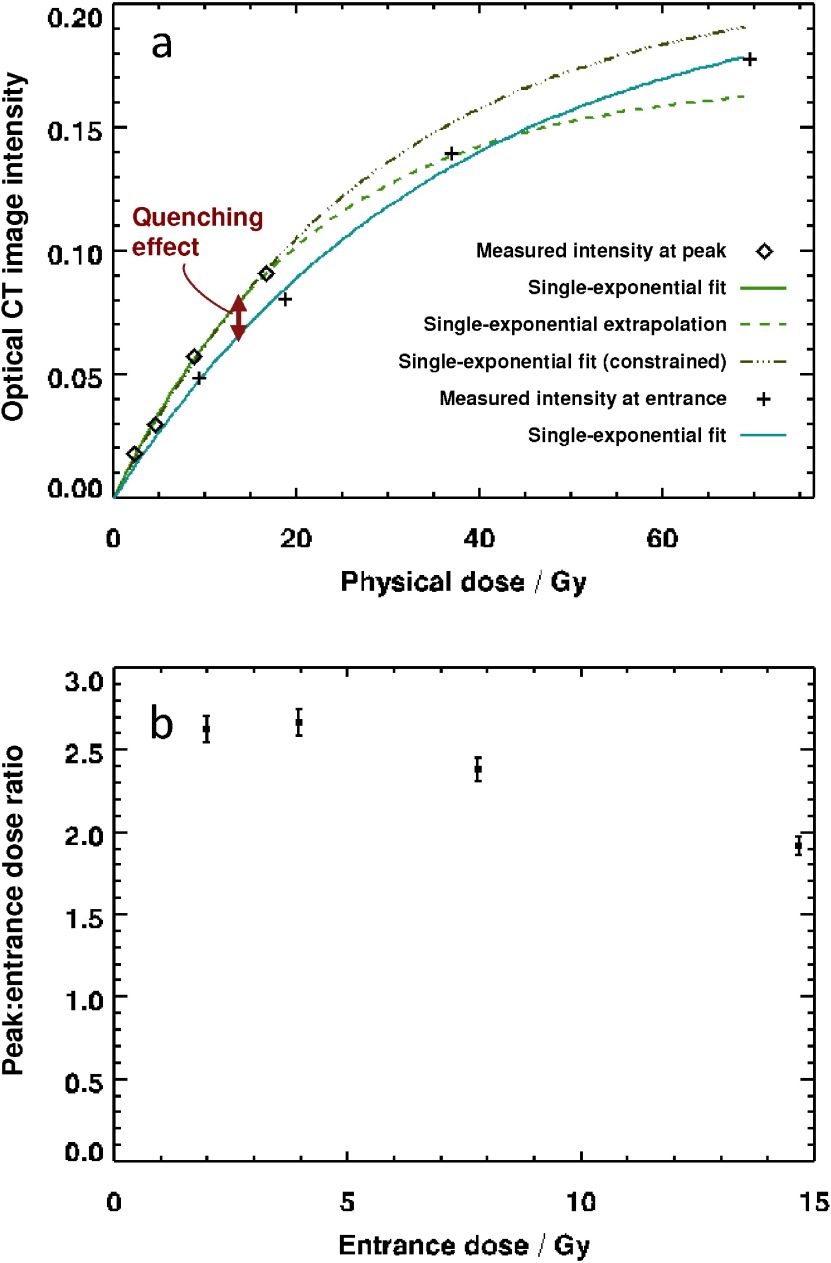
Figure 3.
(a) Optical CT image intensity data from figure 2(a) plotted as a function of dose for the peak and entrance regions of the curve. Fit lines are single-exponential recovery curves, discussed in the main text. The dose values on the horizontal axis have been estimated by multiplying the nominal entrance dose by appropriate ratios obtained from ionization chamber measurements (i.e. correcting for depths of 9.4 and 27.7 mm). Error bars lie within the points and were estimated at 1.5%, corresponding to a small component of random noise (0.3%) and an allowance for sample evolution between scans. (b) Measured ratio of optical CT image intensity at the peak and entrance, plotted as a function of dose. Error bars of 3% are the result of dividing two sets of imaging data.

