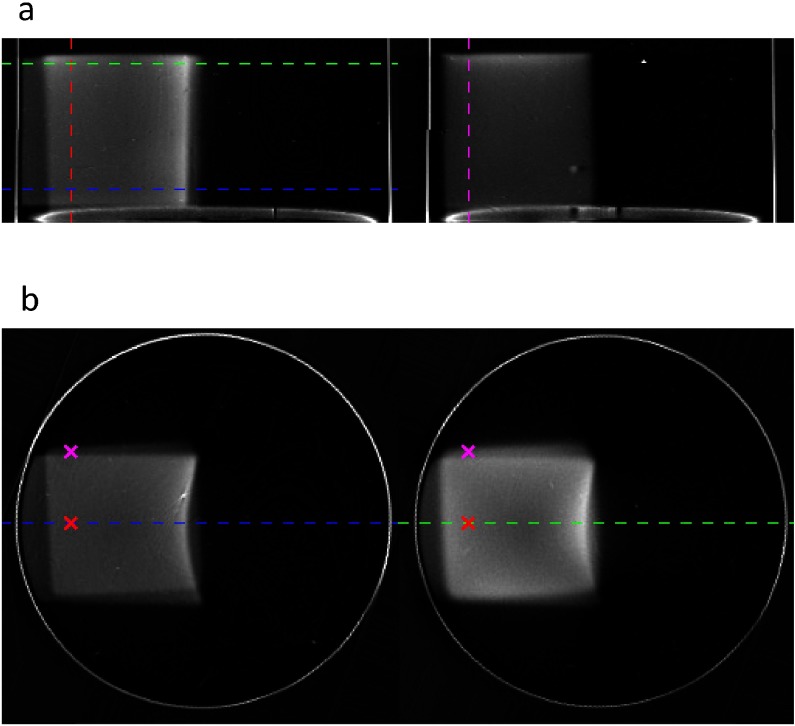
Figure 5.
Result of the experiment to irradiate sample G with two overlapping Bragg peaks along perpendicular axes. (a) Coronal xz, and (b) transverse xy slices through the sample. The dotted lines and crosses correspond to the positions of the profiles displayed in figure 6.

