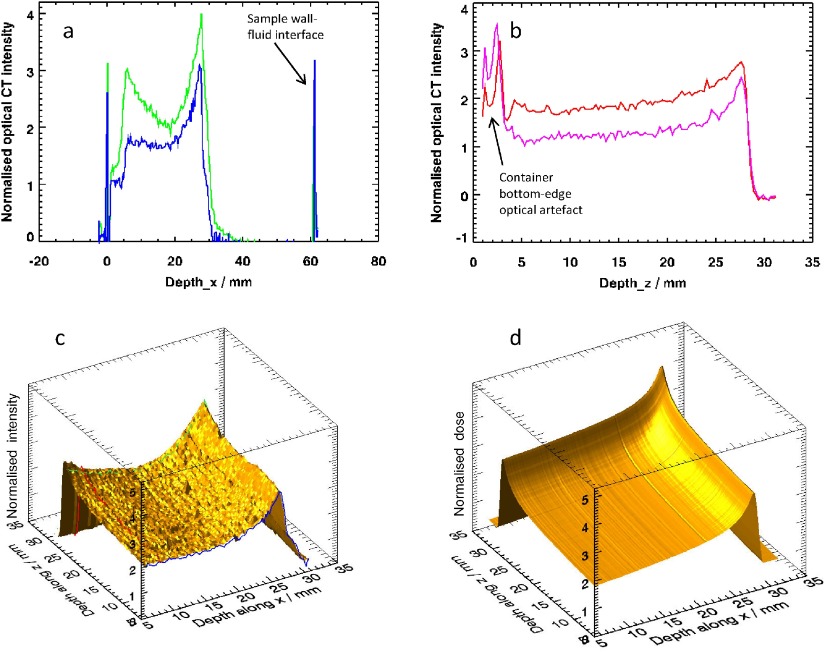
Figure 6.
Result of the experiment to irradiate sample G with two overlapping Bragg peaks along perpendicular axes: (a) profiles along the x-direction at the locations shown by the blue and green dotted lines in figure 5; (b) profiles along the z-direction at the locations represented by the dotted lines and crosses in figure 5; (c) 2D view of the data from the plane through the sample represented by the green dotted line in figure 5(b), with the profiles from (a) and (b) superimposed; (d) corresponding dose prediction based on equation (5).

