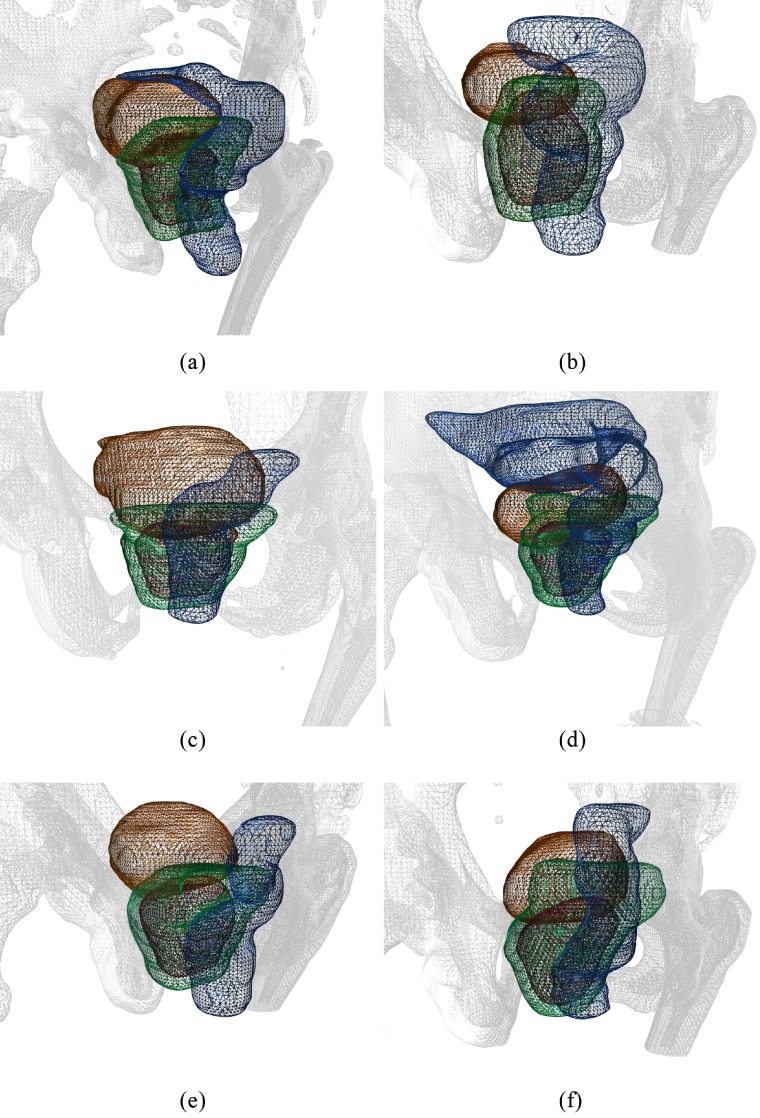
Figure 3.
The six patient geometries for the prostate treatment planning study. Colored triangle meshes are shown for the PTV (green), boost volume (red), rectum (blue) and bladder (orange). A bone segmentation of the planning CT is shown as grey triangle mesh. (a) Patient 1. (b) Patient 2. (c) Patient 3. (d) Patient 4. (e) Patient 5. (f) Patient 6.

