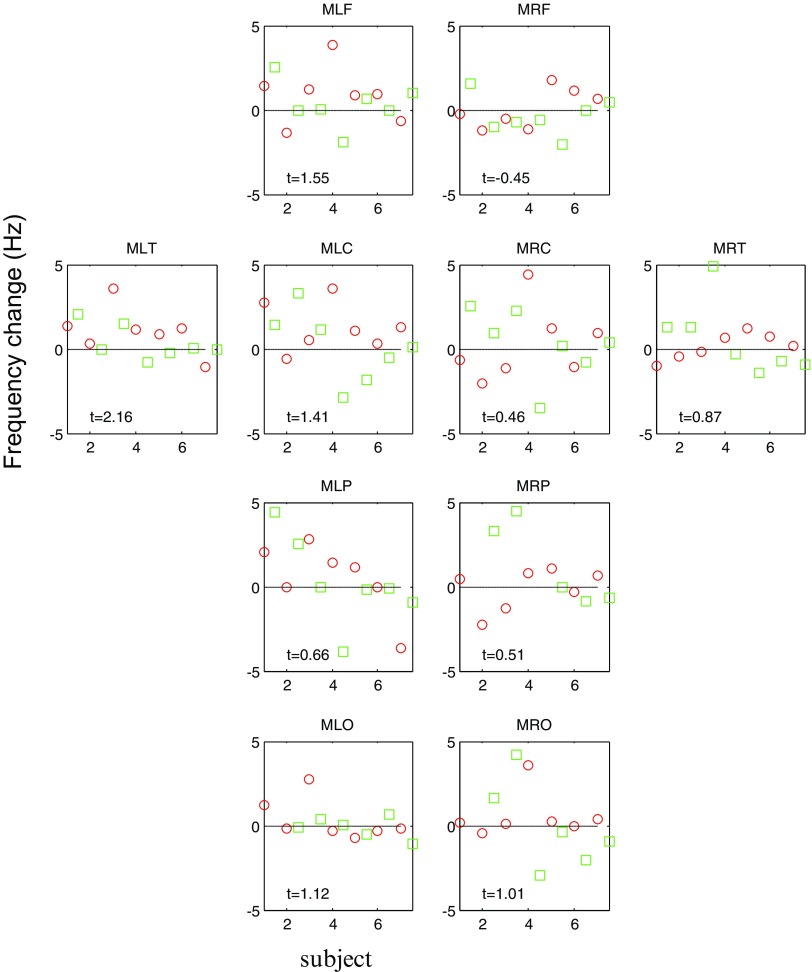
Figure 3.
Change in frequency across cortical regions. This plot is essentially an expanded version of figure 2, detailing changes in frequency over different channel groups. Mean frequency change in Hz (y axis) for the two sessions (session 1 red circles, session 2 green squares) over seven subjects (x axis); positive values indicate an increase in frequency between sham and stimulation conditions. Also shown are one sample t statistics based on the 14 values for each channel group. Note that the most consistent effect of stimulation was observed in the left temporal lobe (MLT, t = +2.16) and that all t-statistics are positive except for the right frontal channel group (MRF).

