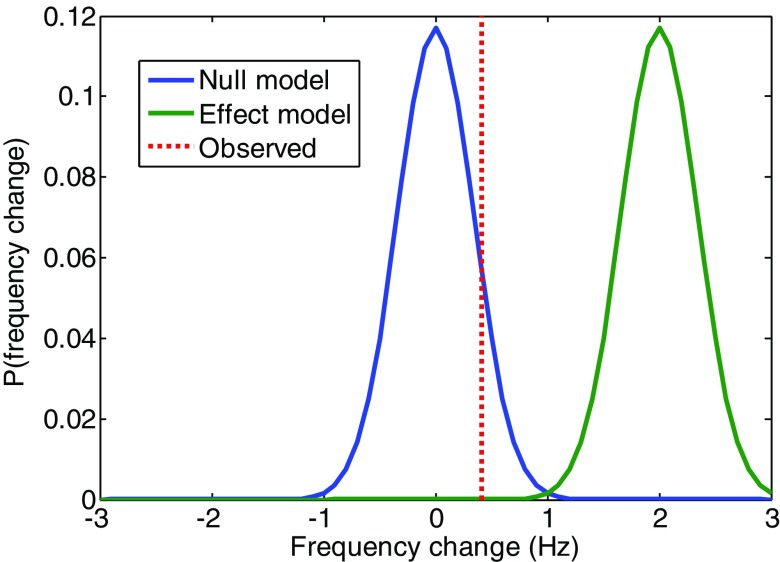
Figure 5.
Bayesian model comparison. The probability distributions for the null (0 Hz) and effect (2 Hz) models (as blue and green solid curves respectively) of frequency change alongside the observed mean frequency change due to stimulation (red dotted). At the observed frequency change (0.415 Hz) the ratio of the probability of the null to the effect model (where they cross the dotted line) is 2200 or a log Bayes factor of 10.04.

