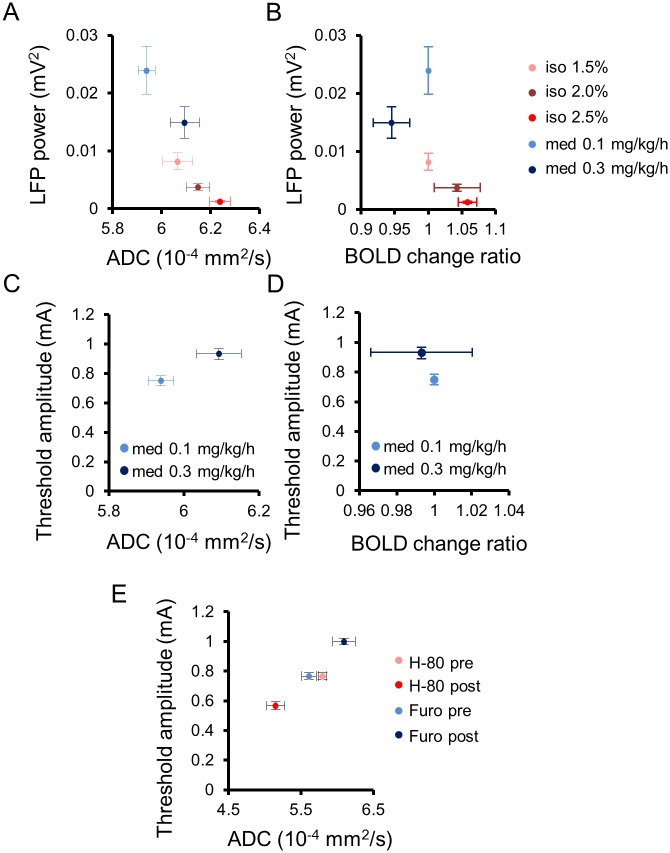
Fig 7. Summarized relationship of the Apparent Diffusion Coefficient (ADC) with underlying neural activity status in the Central Medial thalamic nucleus (CM).
Scatter plots between local field potential (LFP) power and ADC (A) or blood oxygenation level—dependent (BOLD) change ratio (B) in the CM under all anesthetic conditions (isoflurane: 1.5%, 2.0%, and 2.5%; medetomidine: 0.1 and 0.3 mg/kg/h). Scatter plots of CM ADC (C) and CM BOLD change ratio (D) with the threshold amplitude to trigger an awake response during CM electrical stimulation under anesthesia with 0.1 and 0.3 mg/kg/h of medetomidine. (E) Scatter plots between CM ADC and the threshold amplitude to trigger an awake response under anesthesia (0.1 mg/kg/h medetomidine) before and after CM infusion of furosemide and H-80. Data with anesthetic dosages for the CM of individual rats can be found in S1 Data for ADC and S2 Data for BOLD. LFP power data with anesthetic dosages for CM of individual rats can be found in S4 Data. Data for minimum amplitudes of individual rats can be found in S5 Data. ADC data for pharmacological diffusion functional MRI (DfMRI) of individual rats found in S3 Data.

