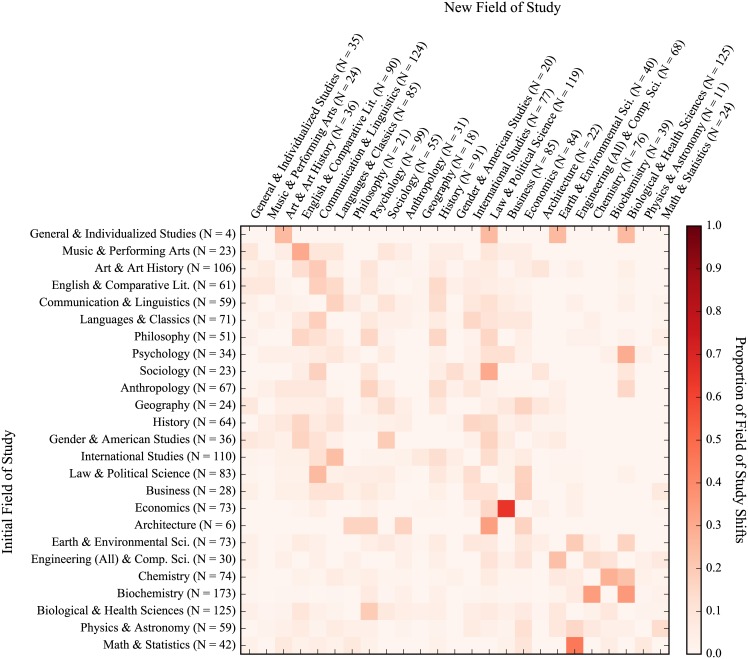
Fig 6. Field of study migration heatmap for 2-year transfers.
Values represent transfer of students from each row to each column. Proportions are normalized across rows. Counts for rows indicate outgoing students while counts for columns indicate incoming students. (NOTE: Figure rotated 90 degrees clockwise.)

