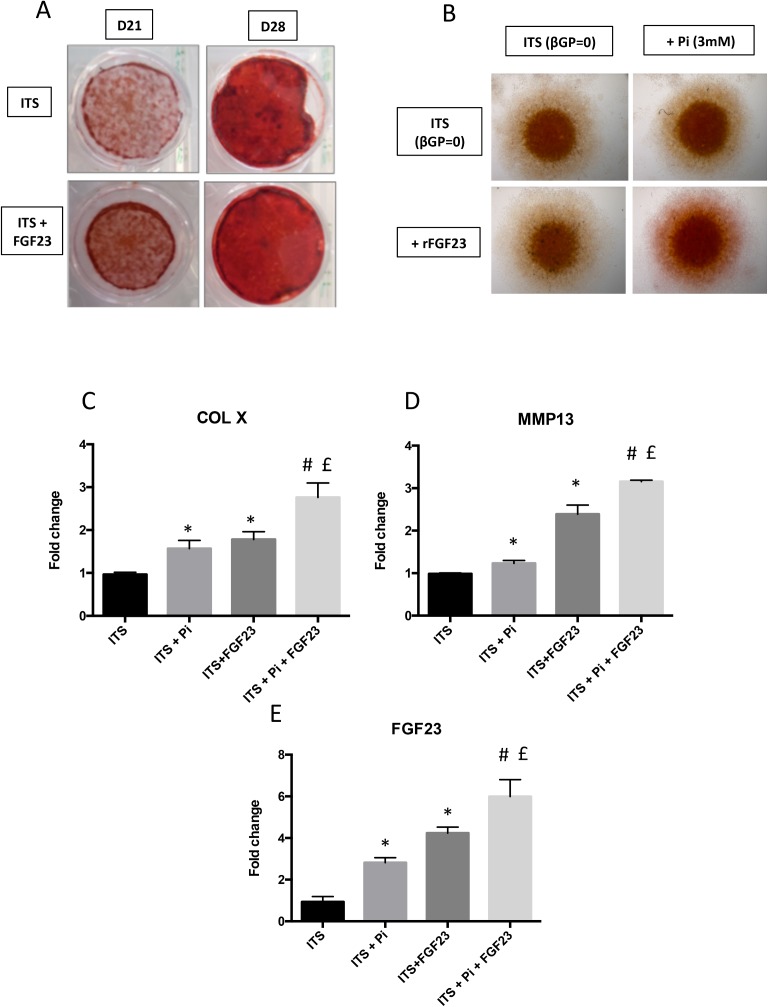
Fig 3. Influence of FGF23 on Pi-induced mineralisation process.
ATDC5 were fixed with 4% PFA, and then stained by Alizarin red for 45min after 21 or 28 days of insulin stimulation with or without 100 ng/mL of mouse rFGF23. Images presented are representative of 5 independent experiments (A). ATDC5 micromasses were cultured for 14 days with insulin stimulation in the presence of 3 mM Pi or 100 ng/mL rFGF23 or both. Then they were fixed with 4% PFA and stained by Alizarin red for 45min. Images presented are representative of 3 independent experiments (B). Total RNA was extracted from ATDC5 cultured in ITS conditions for 14 days, then reverse transcribed into cDNA and analysed by real-time PCR and compared to ITS. The relative abundance of COL X, MMP13 and FGF23 were normalized to RPS29 mRNA (C, D, E). Comparison was made by using the ΔΔCt method with the fold value of reference (fold = 1) assigned to ITS. *: p < 0.05 vs ITS, #: p < 0.05 vs ITS + Pi and £: p < 0.05 vs ITS + rFGF23. Data are expressed as mean ± SD, n = 3.

