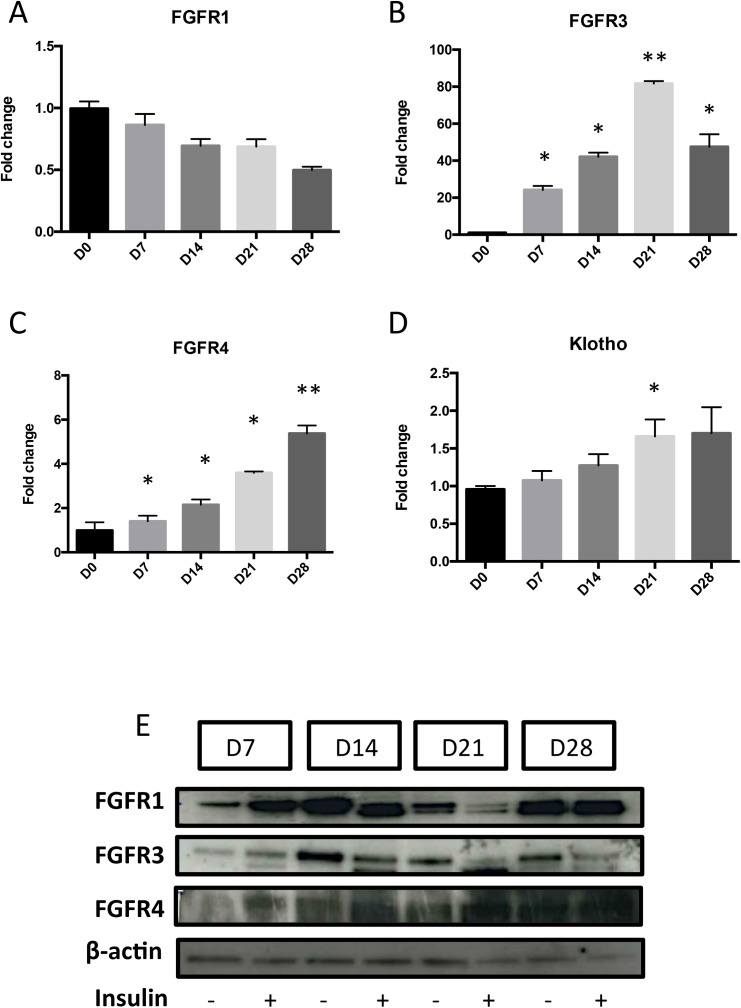
Fig 4. Expression of FGFRs during ATDC5 differentiation.
Total RNA was extracted from ATDC5 cultured in ITS conditions for 0, 7, 14, 21 and 28 days, then reverse transcribed into cDNA and analysed by real-time PCR. The relative abundance of FGFR1 (A), FGFR3 (B), FGFR4 (C) and Klotho (D) were normalized to RPS29 mRNA. Comparison was made by using the ΔΔCt method with the fold value of reference (fold = 1) assigned to D0. *: p < 0.05 vs D0, **: p< 0,01 vs D0. Data are expressed as mean ± SD, n = 4. Total proteins were extracted from ATDC5 (7, 14, 21 or 28 days post-insulin) and 10 μg was subjected to SDS-PAGE with anti-FGFR1, FGFR3 or FGFR4 (1/200) antibodies; ß-actin was used as loading control (E).

