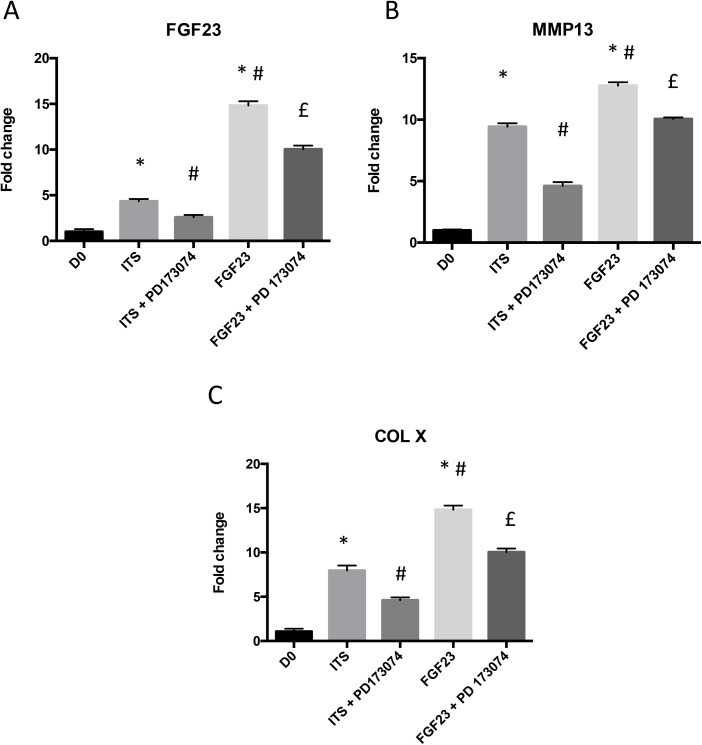
Fig 6. Effect of specific inhibition of FGFR activation during ATDC5 differentiation process and after FGF23 stimulation.
Total RNA was extracted from ATDC5 cultured in ITS conditions for 28 days pre-treated or not with 1 μM PD173074 one hour before stimulation with 100 ng/ml of rFGF23 (24h for RNA or 48h for proteins), then reverse transcribed into cDNA and analysed by real-time PCR. The relative abundance of FGF23 (A), MMP13 (B) and COL X (C) was normalized to RPS29 mRNA. Comparison was made by using the ΔΔCt method with the fold value of reference (fold = 1) assigned to D0. *: p < 0.05 vs D0, # p< 0.05 vs ITS, £: p< 0.01 vs rFGF23. Data are expressed as mean ± SD, n = 3.

