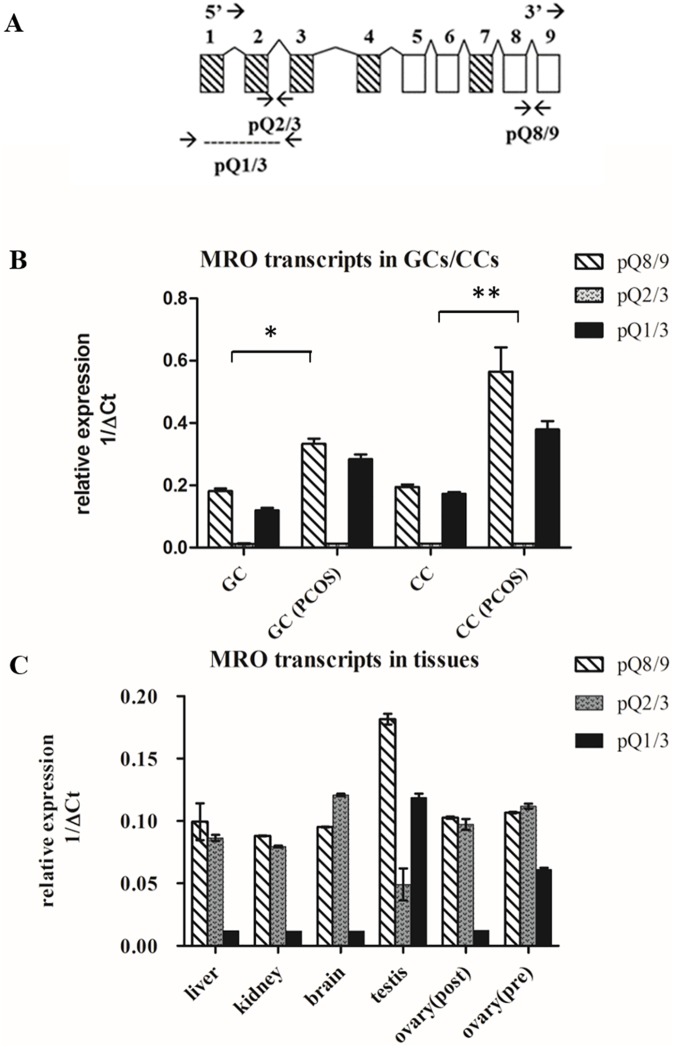
Fig 3. Relative expression of MRO transcripts was analyzed by qPCR.
(A) Schematic representation of the MRO splice variants and the position of the TaqMan probes. Overall expression detected by the pQ8/9 probe. pQ1/3 spans exons 1–3 and detects the 'b' isoforms (MROb1-4); pQ2/3 spans exons 2/3 and detects isoforms MROa,c,d. The expression of MRO was normalized to 18s RNA and presented as relative a expression ratio (1/ΔCt). (B) MRO transcripts analysis in GCs and CCs from PCOS and control subjects. The overall expression, shown by exon 8/9 was higher in PCOS cells vs that of controls (* in GCs and * in CCs; p ≤0.05). Inverse expression of exon 1/3 in GCs and CCs vs exon 2/3 was detected. (C) Inverse expression of exon 2/3 vs 1/3 in kidney, liver, brain and post-menopausal ovary.

