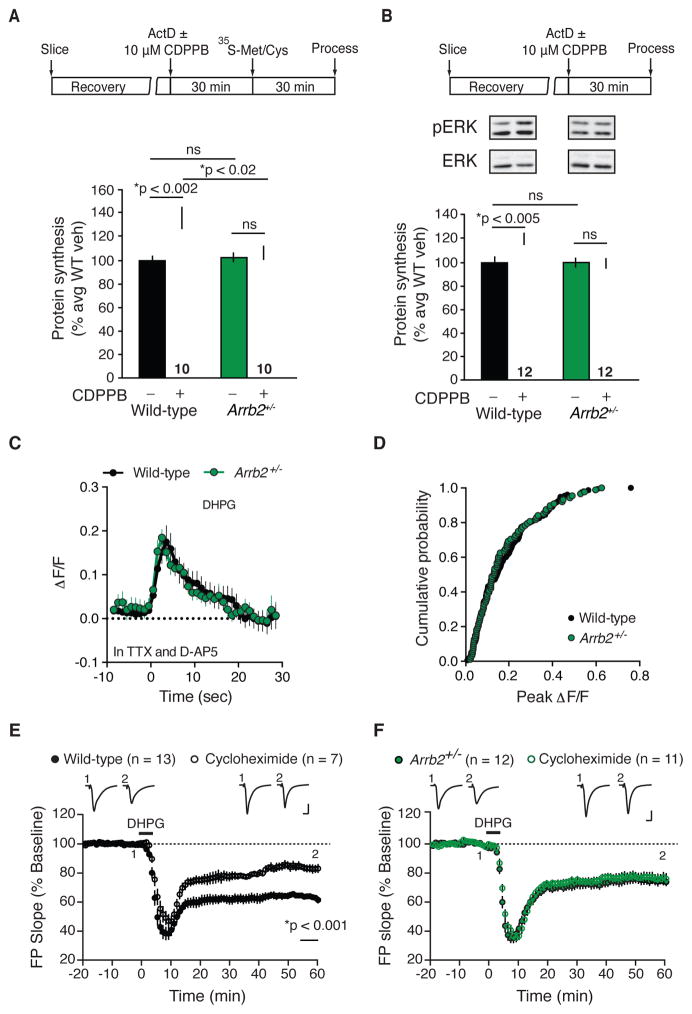
Figure 1. β-arrestin2 is necessary for protein synthesis-dependent mGlu-LTD and ERK1/2 activation.
(A) Schematic illustrates experimental timeline. Protein synthesis was elevated in WT slices stimulated with CDPPB compared with vehicle (two-tailed t test, t = 3.6928, *p = 0.0017, n = 10 animals per group) whereas treatment had no effect in Arrb2+/− slices (two-tailed t test, t = 0.654, p = 0.5214, n = 10 animals per group). Two-way ANOVA, genotype vs. treatment, F = 7.081; *p = 0.012. Mean ± SEM 35S incorporation (%CPM/μg): WT + vehicle = 3.3057 ± 0.2441; WT + CDPPB = 4.4417 ± 0.3196; Arrb2+/− + vehicle = 3.4463 ± 0.3004; Arrb2+/− + CDPPB = 3.3940 ± 0.3397. (B) Representative immunoblots of ERK1/2 phosphorylation and total ERK protein from hippocampal slices ± CDPPB stimulation from WT and Arrb2+/− mice. WT slices stimulated with CDPPB show elevated ERK1/2 phosphorylation compared with vehicle (two-tailed t test, t = 3.1421, *p = 0.0047, n = 12 animals per group), whereas no change was observed in Arrb2+/− mice (two-tailed t test, t = 0.1826, p = 0.8568, n = 12 animals per group). Two-way ANOVA, genotype vs. treatment, F = 6.458, *p = 0.015. Full and uncropped versions of blots underlying the figures are collected in Fig. S4. (C) Quantification of calcium fluorescence over time in WT and Arrb2+/− slices. Data are normalized as ΔF/F as discussed in materials and methods. There is no significant difference in the peak calcium fluorescence measured between WT and Arrb2+/− slices (two-tailed Mann-whitney test, p = 0.7959, Mann-whitney U= 46, n = 10 animals per group). (D) The cumulative probability of peak fluorescence for all cells analyzed is not different between WT and Arrb2+/− slices (Kolmogorov-Smirnov test, p = 0.8334, n = WT, 155 cells, Arrb2−/+, 88 cells). (E, F) DHPG-LTD (25 μM, 5 min) is reduced and unaffected by pretreatment with the protein synthesis inhibitor cycloheximide (CHX, 60 μM) in hippocampal slices from Arrb2+/− animals. Two-way ANOVA, genotype vs. treatment, F = 9.678,*p = 0.003.). Bonferroni multiple comparisons shows a significant effect of genotype under control conditions (*p = 0.005, WT = 13 animals, Arrb2+/− = 12 animals) but not in the presence of CHX (p = 0.125; WT = 9 animals, Arrb2+/− = 11 animals). CHX treatment significantly reduced LTD magnitude in WT slices (*p < 0.001, t = 4.676; control n = 13 animals, CHX n = 9 animals) but not Arrb2+/− slices (p = 0.646, t = 0.463; control n = 12 animals, CHX n = 11 animals). Representative field potential (FP) traces (average of 10 sweeps) were taken at times indicated by numerals. Scales bars equal 0.5 mV, 5 ms. For this and all subsequent figures, data is plotted as mean ± s.e.m. Statistics were performed using each animal as one “n”, with each animal represented by the mean of 1–4 slices, unless otherwise noted. See also Figures S1, S2, and S3.

