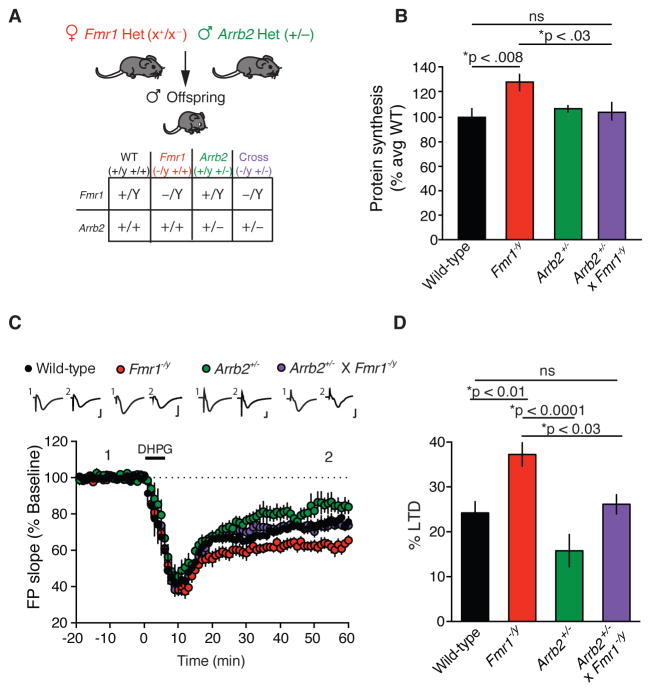
Figure 2. Genetic reduction of β-arrestin2 in Fmr1−/y mice corrects exaggerated protein synthesis and mGlu-LTD.
(A) Genetic rescue strategy. (B) Basal protein synthesis is significantly increased in slices from Fmr1−/y mice compared with WT slices (two-tailed t test, t = 3.0689, *p = 0.0078, n = 9 animals each genotype). Basal protein synthesis is comparable in slices from Arrb2+/− x Fmr1−/y mice and WT mice (two-tailed t test, t = 0.4821, p = 0.6363, n = 9 animals each genotype). Basal protein synthesis is significantly increased in slices from Fmr1−/y mice compared with Arrb2+/− x Fmr1−/y slices (two-tailed t test, t = 2.5243, *p = 0.0225, n = 9 animals each genotype). Mean ± SEM 35S incorporation (%CMP/μg): WT = 2.9183 ± 0.1988; Fmr1−/y = 3.7697 ± 0.1934; Arrb2+/− = 3.135 ± 0.0747; Fmr1−/y x Arrb2+/− = 3.0563 ± 0.2060. (C) The magnitude of DHPG-induced LTD in slices from Arrb2+/− x Fmr1−/y mice is significantly different from Fmr1−/y slices and is indistinguishable from WT slices (One-way ANOVA, *p = 0.0001, F = 8.715, with Bonferroni multiple comparisons: Arrb2+/− x Fmr1−/y vs. Fmr1−/y, *p < 0.03, t = 2.971, Arrb2+/− x Fmr1−/y vs. WT, p = 0.999, t = 0.5741, Arrb2+/− vs. Fmr1−/y, *p < 0.0001, t = 5.033, WT n = 15 animals, Fmr1−/y n = 10 animals, Arrb2+/− n = 9 animals, Arrb2+/− x Fmr1−/y n = 16 animals). Representative FP traces (average of 10 sweeps) were taken at times indicated by numerals. Scales bars equal 0.5 mV, 2ms. (D) Summary of LTD data. Bar graphs, percentage decrease from baseline in FP slope.

