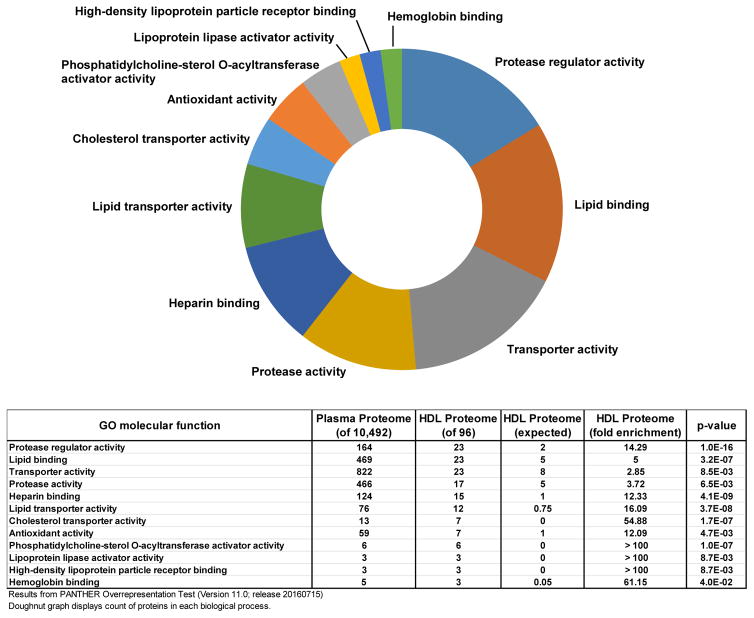
Fig. 1. Gene ontology analysis of HDL proteome molecular function.
The HDL proteome was compared to the plasma proteome and a functional enrichment analysis for GO molecular functions was performed using Panther Overrepresentation Test (version 11.0). Selected molecular functions are displayed to reduce redundancy. The doughnut graph represents the counts of proteins from the HDL proteome in each molecular function category. The table below displays the numerical results of the enrichment test.

