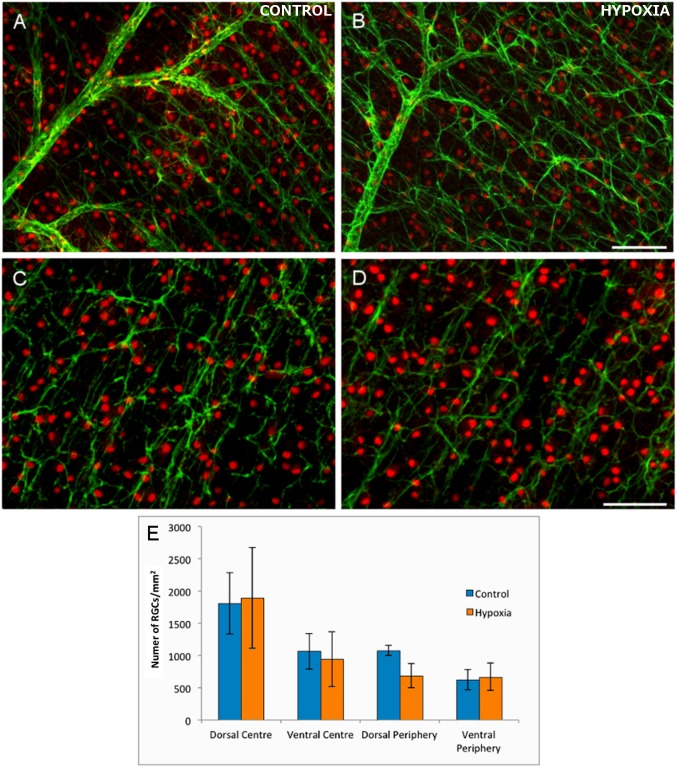
Fig 1. The analysis of flat mount retinas and RGCs.
The cytoskeleton of astrocytes (green) are labelled with antibodies against GFAP and the nuclei of the RGCs (red dots) with antibodies against Brn3a in control (A, C) and hypoxic (B, D) retinas. Note the mild disorganization of the cytoskeleton in astrocytes and the reduction in the number of RGCs in hypoxic animals, although they are not significantly different from the controls. (E) Histogram representing the density of RGCs/mm2 in the four areas of the control and hypoxic retina analysed. Standard errors of the mean are represented as error bars. Scale bar = 100 μm.

