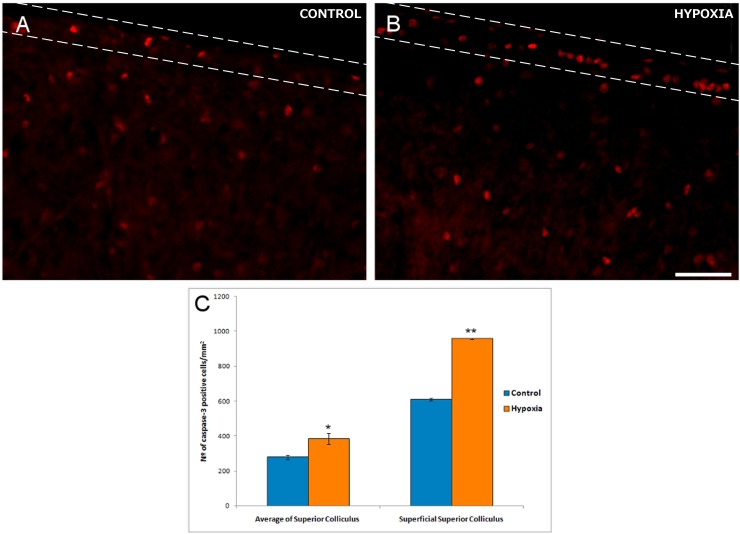
Fig 3. Active caspase-3-positive cells in sections of the superior colliculus.
Images of the superior colliculus from control (A) and hypoxic (B) animals. Note that the superficial layers are defined by the dashed lines. Apoptotic cells are labelled with antibodies against active caspase-3 (red). Note the large number of active caspase-3 positive cells in the superficial layers of the superior colliculus. (C) Significant differences in the density of active caspase-3 positive cells between control and hypoxic pigs are shown in the histograms and the standard error of the mean is represented as an error bar: *p< 0.05, **p<0.01. Scale bar = 50 μm.

