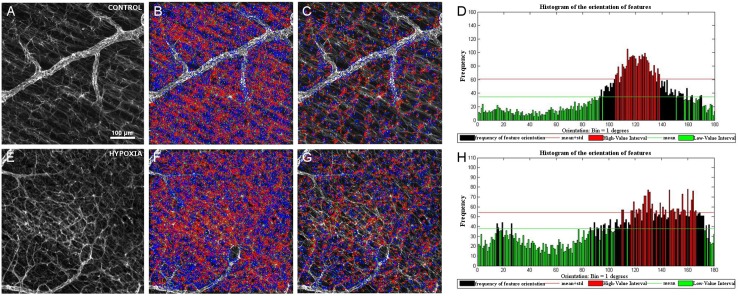
Fig 4. Astrocytes in the retina.
Surf detection in GFAP labelled images of the control (A-D) and hypoxic (E-H) retina. GFAP immunohistochemistry (green) of the retina from control (A) and hypoxic animals (E) showing the relationship in the orientation of the astrocytes relative to the RGC axons (B, F). The relationship between the orientation of processes after removing the features corresponding to the main orientation (C, G). Histograms (D, H) quantifying the disorganization of the astrocytic processes using the Surf feature orientation for the input image: the higher the bar, the greater the number of features orientated in the direction indicated in the abscissa. The red bars indicate the highest number of events that take place at the angle indicated in abscises. Note that in the hypoxic histogram there are more red bars at different angles than in the control retinas. After analysing all the images, no significant differences between control and hypoxic retinas were found.

