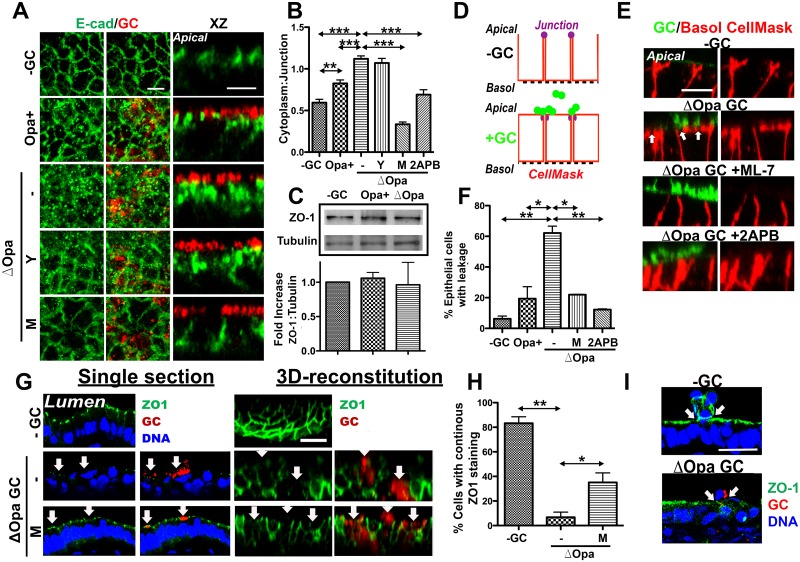
Fig 5. GC induce apical junction disruption in polarized epithelial cells and endocervical tissue explants in a Ca2+- and MLCK-dependent manner.
(A and B) Effects of NMII kinase and Ca2+ inhibitors on the distribution of E-cadherin. Polarized T84 cells were untreated or pre-treated with NMII kinase inhibitors, Y27632 (Y) and ML-7 (M), or a Ca2+ inhibitor, 2APB, and then apically incubated with piliated MS11Opa+ or ΔOpa for 6 h in the presence or absence of inhibitors. (A) Cells were fixed, stained for E-cadherin (E-Cad) and GC, and analyzed using 3D-CFM. (B) The average fluorescence intensity ratios (FIR) (±SD) of E-Cad staining at the cytoplasmic to the cell-cell junctional region was determined from >50 cells of three individual experiments using the NIH ImageJ software. (C) The expression levels of ZO1 in MS11Pil+Opa+- or ΔOpa-infected T84 cells were compared using Western blotting and quantified by the average fold of increases (±SD) in the ratio of ZO1 to tubulin in cell lysates from three independent experiments. (D-F) Effects of MLCK and Ca2+ inhibitors on the membrane lateral movement over the apical junction. (D) Polarized T84 cells treated with inhibitors as above were apically inoculated with fluorescently labeled piliated GC for 4 h and basolaterally stained with CellMask for 15 min. (E) Time lapse xz images were acquired using CFM. (F) The average percentage (±SD) of cells showing the basolaterally stained dye moving over to the apical surface was determined from >50 randomly selected cells of three independent experiments. Scale bar, 5 μm. (G-H) Effects of GC and the MLCK inhibitor ML-7 on the ZO1 distribution in human endocervical tissue explants. The tissue explants were untreated or pre-treated with ML-7 (M) for 1 h and incubated with MS11Pil+ΔOpa for 24 h in the absence or presence of ML-7. Tissues were stained for ZO1, DNA, and GC. (G) Shown are representative CFM (left panels, arrows to GC) and 3D reconstituted images (right panels) (Bar, 10 μm). (H) The average percentages (±SD) of GC-associated cells showing continuous ZO1 staining at the apical region were determined from >15 randomly selected fields (>50 cells) from cervixes of two to three human subjects. ***p ≤0.001; **p ≤ 0.01; *p≤0.05. (I) Representative CFM images of ZO1 distribution in exfoliating and surrounding epithelial cells (arrows) of cervical tissues from 4 human subjects.

