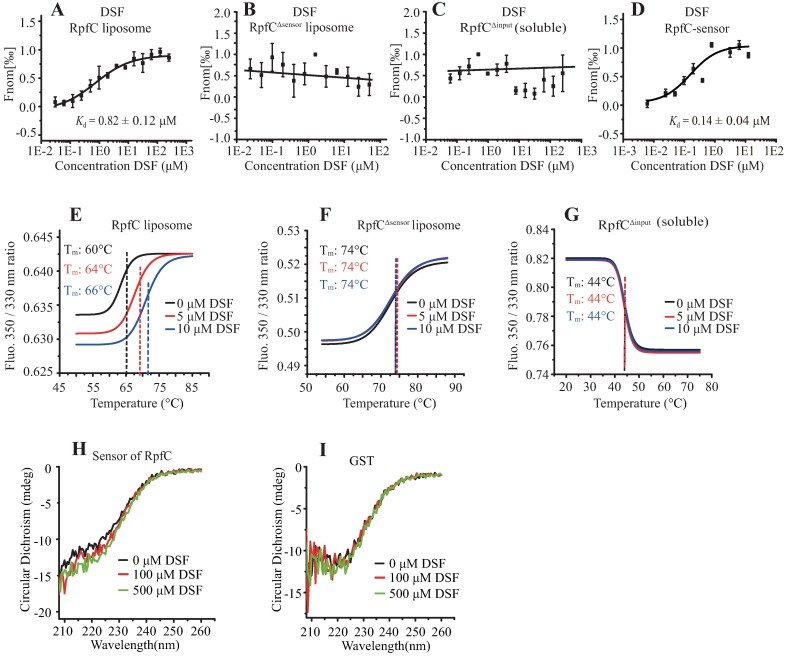
Fig 6. DSF directly binds to the sensor region of RpfC.
(A) DSF binds to RpfC liposome. The concentrations of RpfC liposome were consistently measured as 0.1 μM. (B) RpfC liposome with sensor region deleted did not bind to DSF. (C) Cytosolic RpfC without input region did not bind to DSF. Soluble RpfCΔinput (0.1 μM) was used in the assay. (D) DSF binds to a purified peptide of the RpfC-sensor. In (A-C), titrations of DSF ranged from 0.06 to 2000 μM. In (D), titrations of DSF ranged from 0.0122 to 25 μM. The solid curve is the fit of the data points to the standard KD-Fit function. Each binding assay was repeated independently three times, and black bars represent standard deviations. Kd = dissociation constant. (E-G) Representative melting curves of RpfC in temperature shift assay with differential scanning fluorimetry. Melting temperatures (Tm) of the RpfC liposome, RpfCΔsensor liposome, and soluble, RpfCΔinput protein were shown as average of three independent measurement (n = 3). (H and I) Comparison of the CD spectra of RpfC sensor with various concentrations of DSF. The different concentrations of DSF are as indicated. The concentration of the purified RpfC sensor and GST were 60 μM and 6 μM, respectively. The measurements were carried out at room temperature. The data are representative of two independent experiments.

