-
D
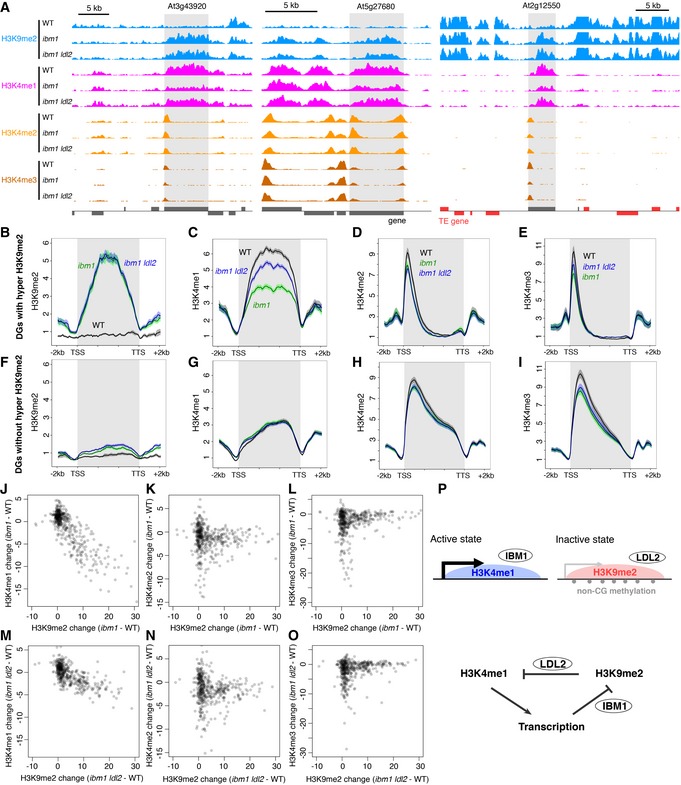
Patterns of H3K9me2 (range; 0–8), H3K4me1 (0–5), H3K4me2 (0–10), and H3K4me3 (0–15) around representative DGs (shaded). Normalized coverage (per million mapped reads) is shown. Genes (dark gray) and TE genes (red) in forward and reverse orientations are shown above and below the line, respectively.
-
B–I
Averaged profiles of H3K9me2 (B, F), H3K4me1 (C, G), H3K4me2 (D, H), and H3K4me3 (E, I) around DGs with (B–E) or without (F–I) hyper H3K9me2. The numbers of genes analyzed are 122 (B–E) and 321 (F–I). The ribbons indicate s.e.m.
-
J–O
Relationships between changes in H3K9me2 and H3K4me1 (J, M), H3K4me2 (K, N), and H3K4me3 (L, O) levels in ibm1 (J–L) or ibm1 ldl2 (M–O) compared to WT within each DG represented by each dot. Value represents RPKM.
-
P
A model for differentiation of bi‐stable epigenetic states through opposing actions of histone demethylases LDL2 and IBM1. See text for details.

