
Figure EV3. SPR analysis of FP‐convertase complexes.
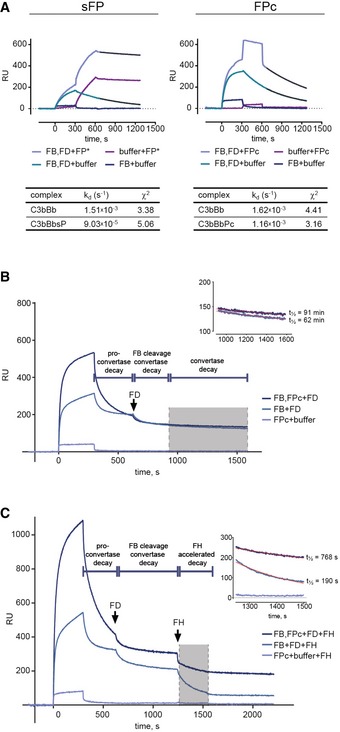
- C3b was immobilized via biotin–streptavidin linkage on the biosensor (1,451 RU). Left: AP C3 convertase was formed by injecting a mixture of inactive FB S699A (10 μg/ml) and FD (2 μg/ml). After 300 s, one channel was injected with sFP (5 μg/ml), while another channel was left to dissociate, KD was calculated by fitting the dissociation phase (t = 650–1,250 s) to a 1:1 model. Right: The C3 convertase was formed by injecting a mixture of FB S699A (20 μg/ml) and FD (4 μg/ml) for 300 s. One channel was injected with FPc (50 μg/ml), and another channel was left to dissociate. C3bBbPc exhibited a two‐state dissociation of which the latter (t = 650–1,250 s) was used for calculating KD. Quality of fit is expressed as χ2.
- SPR experiment similar to Fig 4D but performed with immobilized C3MA. FB D279G/S699A was used to reduce the convertase dissociation rate.
- SPR experiment similar to Fig 4E but performed with immobilized C3MA. FB D279G/S699A was used to reduce the convertase dissociation rate.