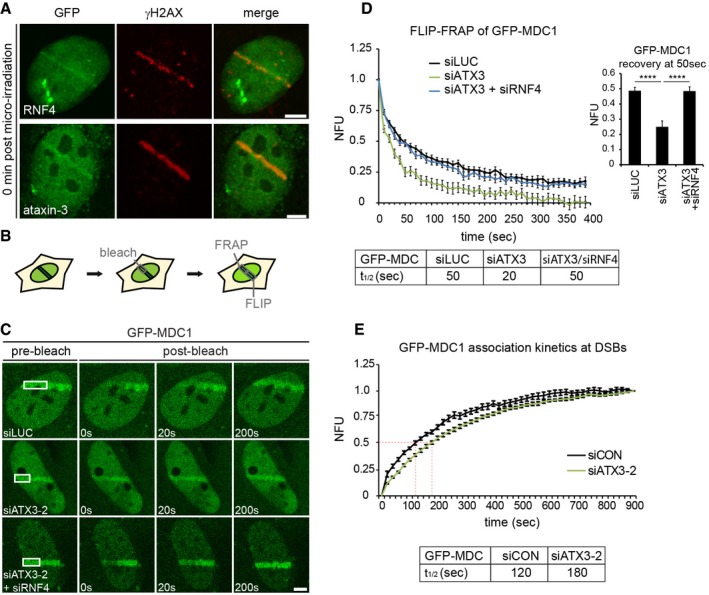
U2OS cells transfected with GFP‐RNF4 or GFP‐ataxin‐3 were subjected to laser micro‐irradiation, fixed immediately, and analyzed by immunolabeling.
U2OS cells stably expressing GFP‐MDC1 were laser micro‐irradiated, and GFP‐MDC1 was allowed to accumulate at laser‐induced DNA damage for 3 min. One half of the laser tracks was photobleached. The loss of fluorescence (FLIP) in the non‐bleached half and the recovery of fluorescence (FRAP) in the bleached half were monitored with low laser power.
Micrographs of GFP‐MDC1 at sites of DNA damage in micro‐irradiated living cells. The pre‐bleach and indicated post‐bleach time points are shown.
Quantification of the exchange rate of GFP‐MDC1 is represented as FLIP‐FRAP normalized to 1. The recovery time of GFP‐MDC1 in bleached areas at 50 s in control, ataxin‐3‐depleted, or ataxin‐3‐ and RNF4‐depleted cells is depicted. Data are presented as mean ± SEM from two independent experiments. ****P ≤ 0.0001 (Kruskal–Wallis test).
Quantification of time lapse imaging of GFP‐MDC1 in living cells. Stably expressing GFP‐MDC1 U2OS cells were transfected with indicated siRNAs, subjected to laser micro‐irradiation, and monitored for 15 min under live cell imaging conditions, taking an image every 20 s. Accumulated levels of GFP‐MDC1 on laser lines were determined, and t
1/2 was calculated. Data are presented as mean ± SEM of two independent experiments.
Data information: Scale bars, 5 μm.