
Figure 1. Efficient localization of HyD‐LIRs‐GFP to mRFP‐LC3B‐positive autophagosomes.
-
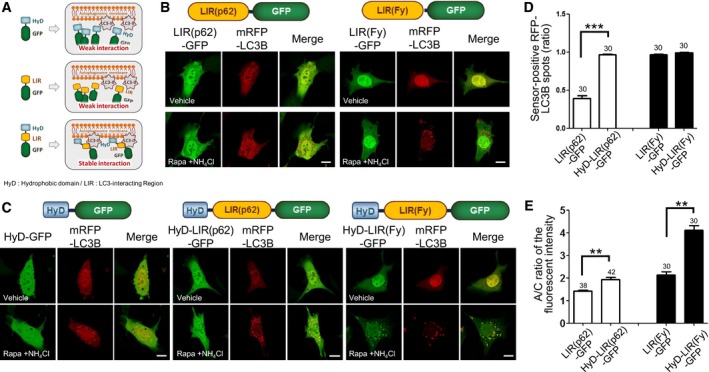
ASchematic model of the development of new autophagosome sensors. LIR: LC3‐interacting region, HyD: hydrophobic domain.
-
B, CConfocal images showing cellular localization of various LIR‐GFP constructs (HyD‐GFP, LIR(p62)‐GFP, HyD‐LIR(p62)‐GFP, LIR(Fy)‐GFP, or HyD‐LIR(Fy)‐GFP) together with mRFP‐LC3B in MEFs incubated with 100 nM rapamycin (Rapa) + 10 mM NH4Cl for 4 h. Scale bar: 10 μm.
-
D, EThe bar graphs illustrate the ratios of sensor‐positive mRFP‐LC3B spots (D) and ratios of autophagosomal/cytosol (A/C) fluorescence intensity (E) of each tested GFP sensor construct. The values are presented as the mean ± SEM. ***P < 0.001, two‐tailed unpaired Student's t‐test. **P < 0.001, two‐tailed Mann–Whitney U‐test. The numbers on the bars indicate the number of cells used for the experiment.