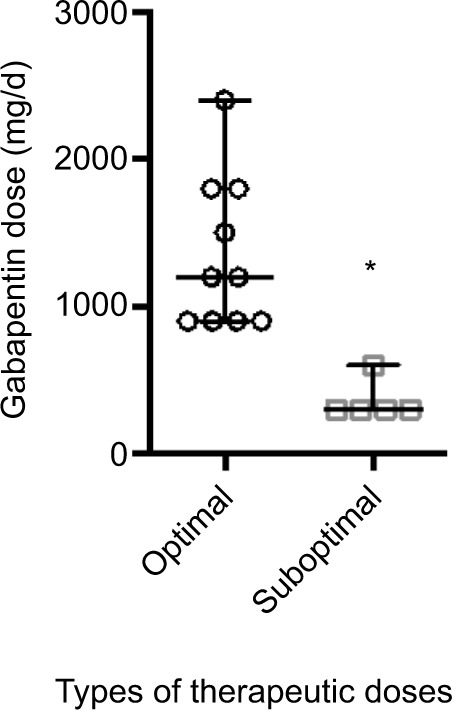
Figure 3.

Comparison of doses between patients receiving AAN-recommended doses of gabapentin (optimal) and doses below AAN recommendation (suboptimal).
Notes: *p<0.05 between groups, Mann–Whitney U-test. Data are represented as median with range.
Abbreviation: AAN, American Academy of Neurology.
