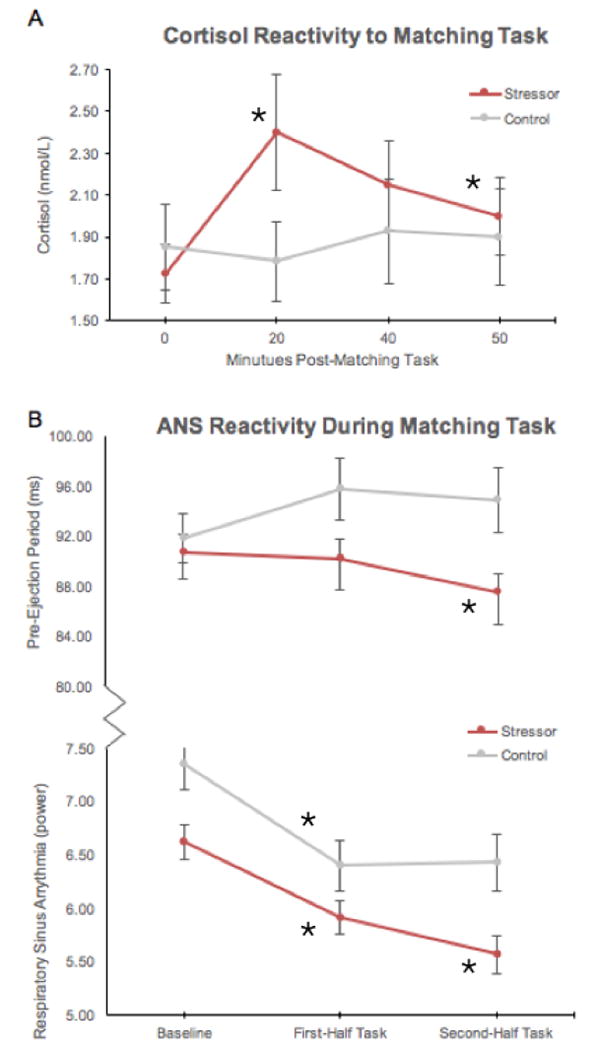
Figure 1. Effects of Acute Stress on Biological Measures Across Time.

Line graphs illustrating changes in Cortisol, PEP, and RSA for the Stressor and Control groups. A) Stressor group showed a significant rise in Cortisol from 0 to 20 minutes, and significant recovery at 50 minutes relative to 20 minutes. B) Stressor group showed a significant shortening of PEP in time-half of the matching task. C) Both groups showed reduction in RSA from baseline to first-half of the matching task, but only the Stressor group showed a further decrease in RSA during the second-half of the matching task. nmol/L = nanomole per liter; ms = milliseconds.
