FIGURE 1:
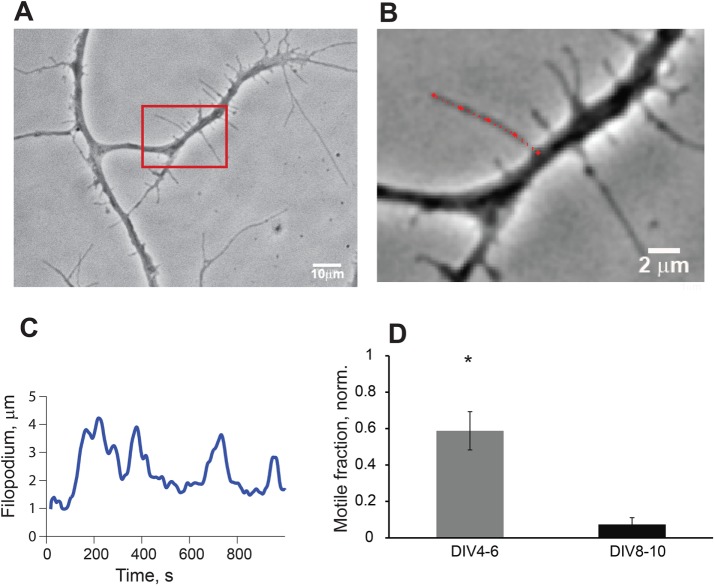
Analysis of filopodia motility with automated tracking software FiloTracker. (A) Phase-contrast image of hippocampal pyramidal neuron in culture, DIV5, with dendrites covered with filopodia; scale bar, 10 µm. (B) High-magnification image of boxed area in A during length tracking process in FiloTracker; red dotted line is a length estimate for the current frame; scale bar, 2 µm. (C) Output sample of length measurements from the filopodia in B (red); acquisition rate, 1 frame/s; periodicity of length, ∼122 ± 19 s. (D) Comparison of motile fraction of all filopodia in imaging session (t = 30 min) at DIV4–9 and DIV8–10 (t test, p < 0.05).

