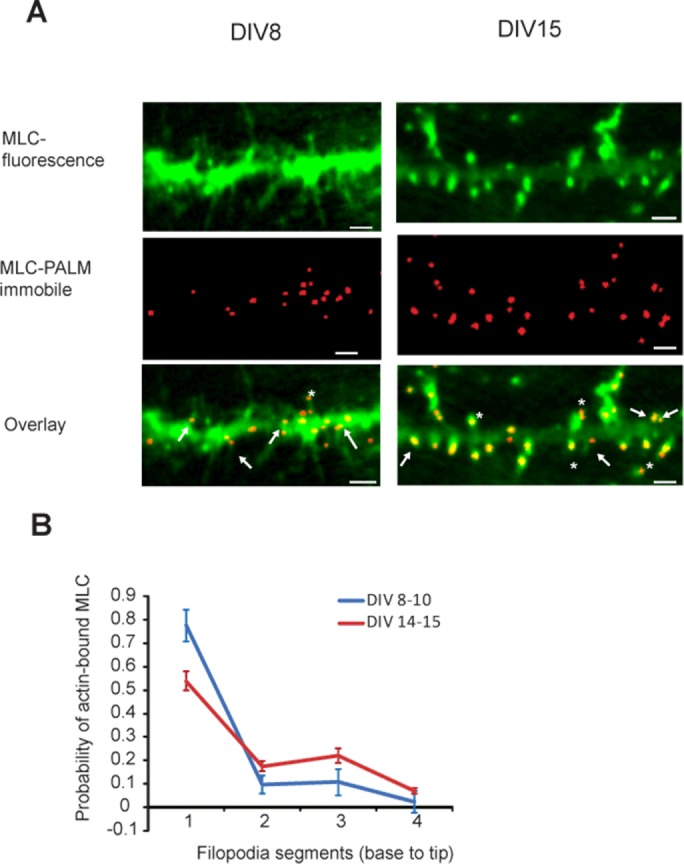
FIGURE 4:

Localization of myosin (MLC) in dendrites using PALM imaging. (A) Top, epifluorescence images of neurons transfected with Eos-MLC. Middle, corresponding PALM images constructed with only the immobile subpopulation of the molecules. Bottom, overlay of the top and middle images. Arrowheads indicate immobile MLC localization in the base of the filopodia. Asterisks indicate immobile MLC localization in the spine heads. Scale bar, 3 μm. (B) Probability of MLC to be found in one of the four segments of the filopodium during early development (DIV8–10; 26 filopodia) vs. late development (DIV 14–15; 25 filopodia). Error bars represent SEM; numbers indicate relative distance from the base.
