FIGURE 7:
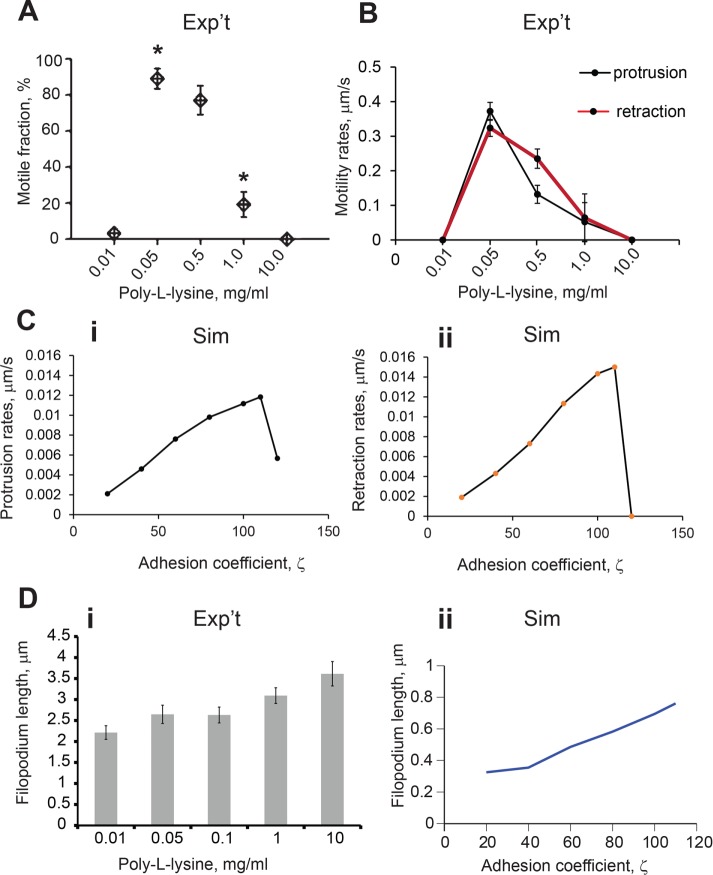
PLL–substrate adhesion strength regulates filopodial motility. (A) The highest number of motile filopodia was observed on substrates with medium PLL concentration; using one-way ANOVA, motile fraction at 0.05 and 0.5 mg/ml were not significantly different from each other but were each significantly different from the filopodia at 0.01, 1.0, and 10.0 mg/ml (433 filopodia, 36 neurons; p < 0.001, ANOVA; error bars are SEM). (B) Protrusion and retraction rates from filopodia grown on substrates of different PLL concentration (DIV4–5, 316 filopodia, 20 neurons); using one-way ANOVA, motility rates at 0.05 and 0.5 mg/ml were significantly different from each other and were each significantly different from the less motile filopodia at 0.01, 1.0, and 10.0 mg/ml (p < 0.001; error bars are SEM). (C) Protrusion and retraction rates from simulated filopodia within adhesion coefficient range (20–115) demonstrate a biphasic relationship between adhesion forces and filopodial dynamics. The simulations are initiated with mb = 0 and L0 = 1 µm; they both quickly approach nonmotile steady-state lengths, bracketing the intermediate ζ values that produce oscillations. Other parameters in these simulations are L0 = 1, koff = 0.13, kon = 0.12, vp = 0.9, m0 = 25, η = 100, σ0 = 25, β = 5250, and D = 0.04. (D) Comparison of filopodial length change in modeling and experimental results: (i) average filopodial lengths on the range of PLL concentrations (433 filopodia, 36 neurons; ANOVA, p < 0.005; error bars are SEM; Tukey post hoc test: group 0.1 mg/ml has mean not statistically different from other groups; other four groups have means statistically different from each other. (ii) Simulated filopodia lengths in the range of the drag force parameter ζ [20, 110].

