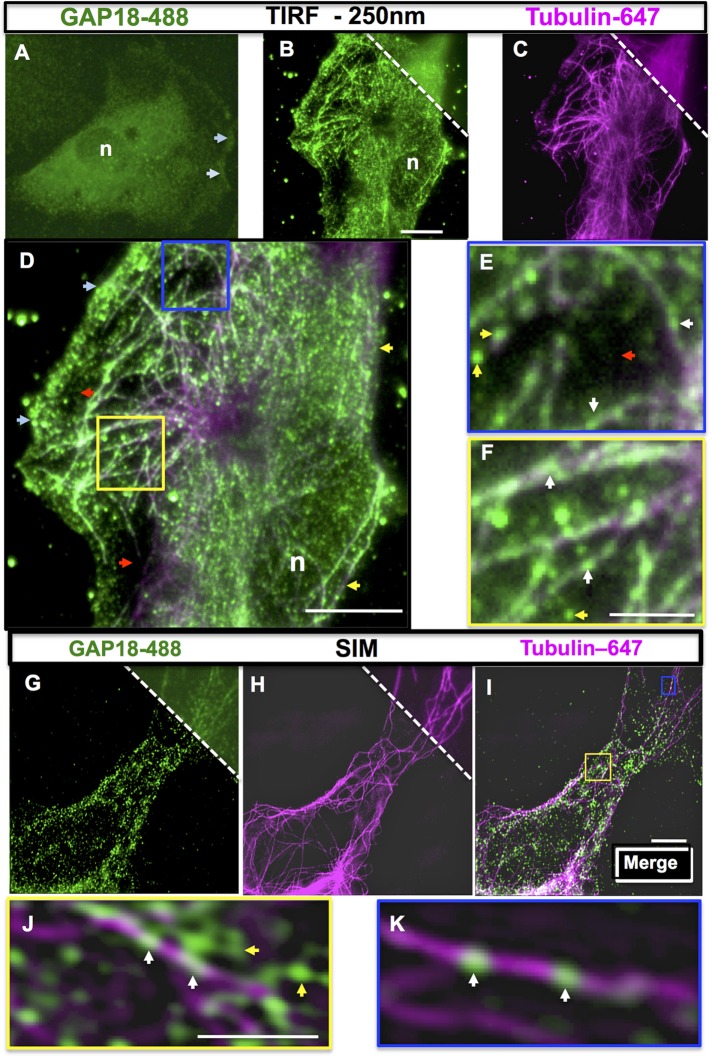
FIGURE 1:
ARHGAP18 localizes to the cytosol, membrane ruffles, and microtubules in cultured ECs. (A–F) Wide-field imaging of ARHGAP18 shows broad expression in nonconfluent ECs. (A) Spread EC with ARHGAP18 expression at the peripheral membrane ruffles (light blue arrows) and perinuclear region; n, nucleus. Magnification, 630× (A), 1000× (B–F). TIRF imaging of ARHGAP18 (green; B) and α-tubulin–Alexa 647 (magenta; C) to identify MTs; wide-field view is shown at the top right. Scale bar, 10 μm (B). (D) Merge of B and C. ARHGAP18–Alexa 488 immunopositivity is evident to the left side of an EC (light blue arrows), whereas the fringe of the right side of the same cell shows even, diffuse staining (yellow arrows). Reduced ARHGAP18 immunopositivity is seen in some areas adjacent to the cell periphery (red arrowheads in D; n, nucleus). (E, F) Enlarged blue and yellow boxes from G, showing ARHGAP18 puncta along microtubules (white arrows); yellow arrowheads indicate puncta that appear to be cytosolic. Scale bar, 10 μm (D), 2.5 μm (F). (G–K) Localization of ARHGAP18 to MTs by SIM imaging. (G) ARHGAP18–Alexa 488 and (H) α-tubulin–Alexa 647 staining in SIM. Wide-field view of each image is shown at the top right. (I) Merge of SIM images. Small yellow and blue boxes in I are enlarged in J and K, respectively, to show representative contents of that region. White arrows indicate puncta localized to MTs; yellow arrows indicate cytosolic ARHGAP18 puncta not bound to MTs. Scale bar, 5 μm (I), 1.25 μm (J).

