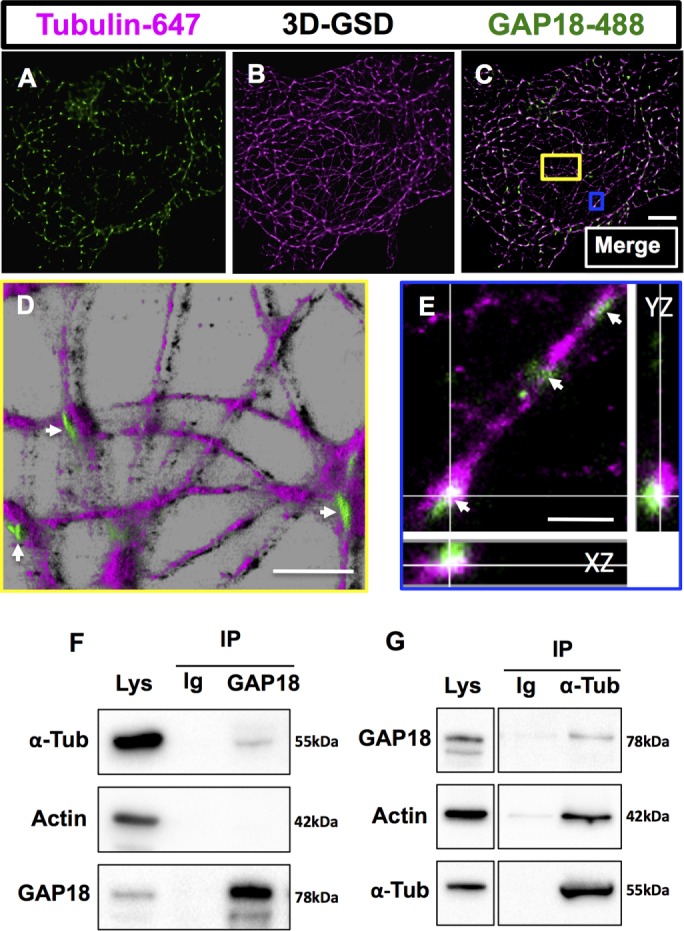
FIGURE 3:

ARHGAP18 puncta are localized along MTs as confirmed by 3D GSD. SRM and coIP. The 3D GSD of an EC reveals that ARHGAP18 puncta wrap around microtubules (z-slices = 16; field of view is 40 μm × 40 μm). Single-channel 3D GSD of (A) ARHGAP18–Alexa 488 direct conjugate and (B) tubulin–Alexa 647. (C) Merge of A and B. (D, E) Zoomed and reconstructed 3D segments (in Imaris software) of the areas indicated by the colored boxes in C. (D) ARHGAP18 puncta are seen on top of the MTs (white arrowheads) in a reconstruction in Imaris (blend mode). (E) ARHGAP18 puncta can be seen localized around the MT filaments (white arrowheads). XZ and YZ are z-projections in each axis at the cross-hair point indicated. Scale bar, 5 μm (C), 1.25 μm (D), 500 nm (E). Note that due to photobleaching and the extended imaging times required for 3D GSD microscopy, cytosolic ARHGAP18 puncta do not resolve well in 3D GSD mode, as not enough positive thresholded events are collected. (F, G) ARHGAP18, actin, and α-tubulin were detected with specific antibodies in EC whole-cell lysate (Lys). (F) The coIP of ARHGAP18 and tubulin, IP of ARHGAP18, and probing for α-tubulin. (G) The coIP of ARHGAP18 and tubulin, IP of α-tubulin, and probing for ARHGAP18. IgG (Ig) antibody used as a control in pull downs showed no bands.
