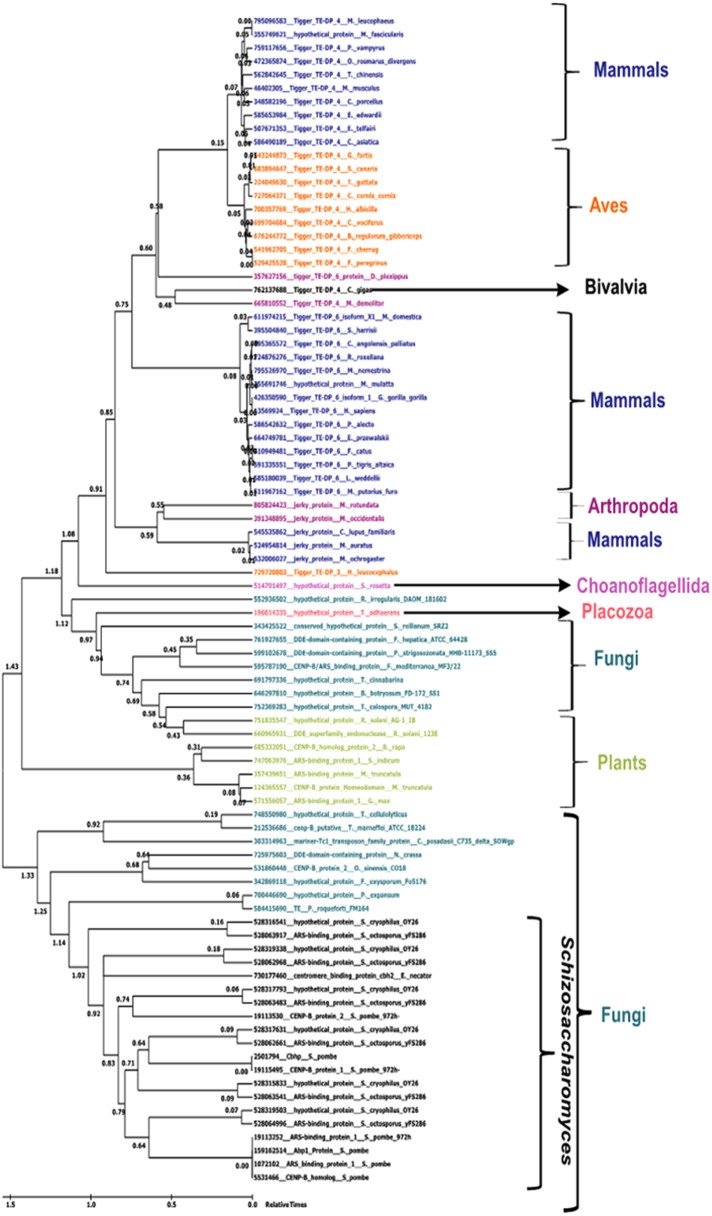
FIGURE 6:
Maximum likelihood analysis–based phylogenetic relationship of CENPB proteins in various species. The scale indicates relative times from 0 to 1.5 billion years ago. Taxon names are colored based on class: Mammalia, Aves, Schizosaccharomyces, Amphibia, Actinopterygii, alligator, Plantae, and Fungi.

