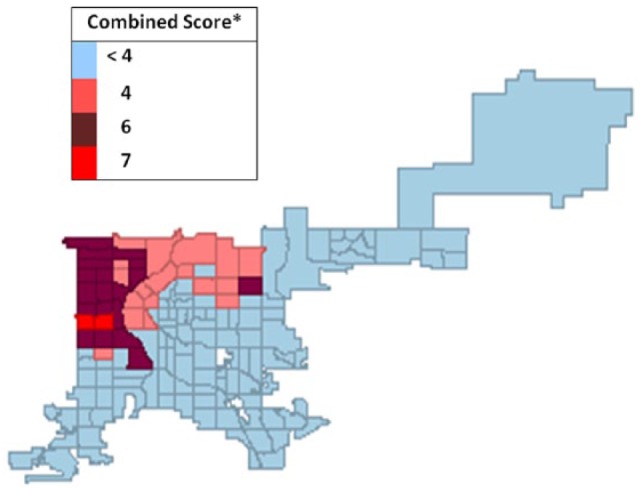
Figure 7.

Map of combined spatial weight scoringa for pertussis vaccine up-to-date (UTD) rates by census tract, Denver, CO, 2012.
aScore determination: the score is determined by adding the number of times a census tract (CT) appeared in any Gi and Gi* high-high cluster. Maximum possible CT score was 12. Gi and Gi* inclusions were counted only when they corresponded to high-high UTD LISA clusters generated using the spatial rate smoothing method combined with queen contiguity, rook contiguity, and k-nearest neighbor spatial weighting types.
