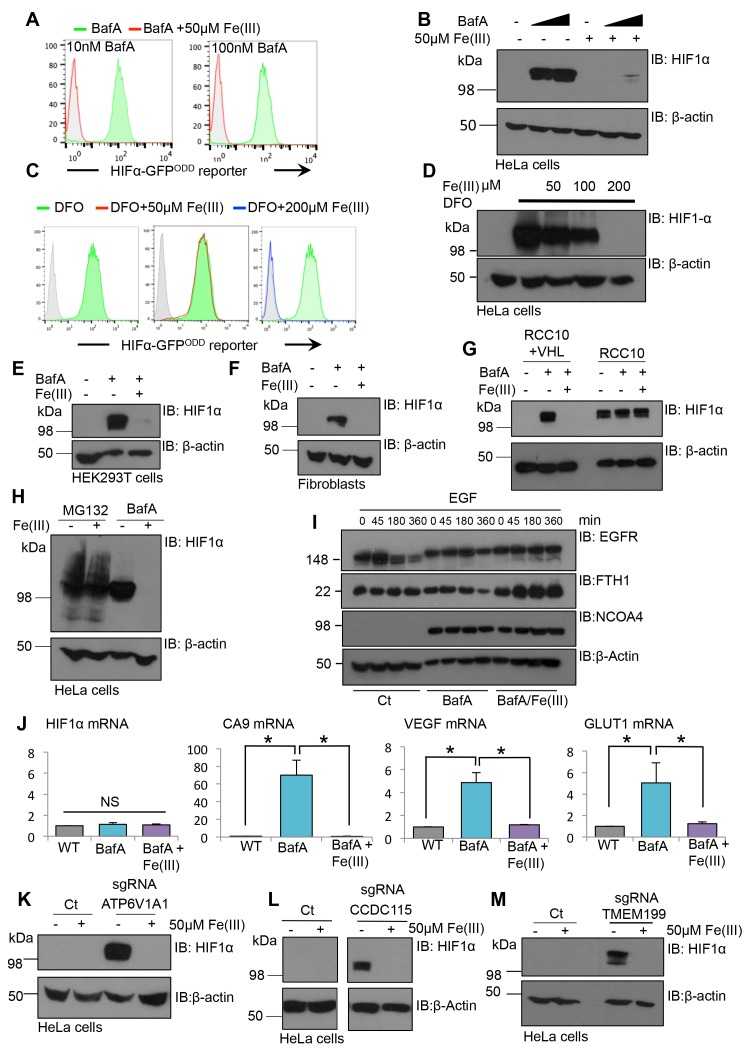
Figure 9. Iron supplementation restores HIF1 activity to basal levels following V-ATPase inhibition in cell lines and primary cells.
(A–D) Iron reconstitution in BafA or DFO treated HeLa cells. (A, C) HIF1α-GFPODD reporter cells were treated with BafA (10 nM or 100 nM), or 100 µM DFO for 24 hr with 50 µM iron citrate (Fe(III)) (red), 200 µM Fe(III) (blue) or no iron (green), and GFP levels analysed by flow cytometry. (B, D) Wildtype HeLa cells were treated with or without BafA (10 nM or 100 nM) or DFO (100 µM) and Fe(III) (50–200 µM) as described, and endogenous HIF1α levels were measured by immunoblot. (E–G) HEK293T cells (E), human dermal fibroblasts (F) and RCC10 VHL null and VHL reconstituted cells (G) were treated with BafA (10 nM) with or without the addition of 50 µM iron citrate (Fe(III)). HIF1α levels were visualised by immunoblot. β-actin served as a loading control. (H) HeLa cells were treated with 20 µM MG132 for 2 hr or 10 nM BafA for 24 hr with or without the addition of 50 µM iron citrate. (I) EGFR degradation assay for BafA treated cells following iron treatment. HeLa cells were cultured with 10 nM BafA for 24 hr, with or without 50 µM iron citrate (Fe(III)), and stimulated with EGF as previously described. EGFR, NCOA4, and ferritin (FTH1) levels were visualised by immunoblot. β-actin was used as a loading control. (J) RT-qPCR analysis of HIF1α and its target genes in response to BafA and iron citrate treatment (n ≥ 2). (K–M) Populations of mixed CRISPR KO cells for ATP6V1A1 (K), TMEM199 (L) and CCDC115 (M) were treated with 50 µM iron citrate for 24 hr and HIF1α levels measured by immunoblot. Values are mean±SEM. *p<0.05, **p<0.01. NS = not significant.

