. 2017 Mar 23;6:e22510. doi: 10.7554/eLife.22510

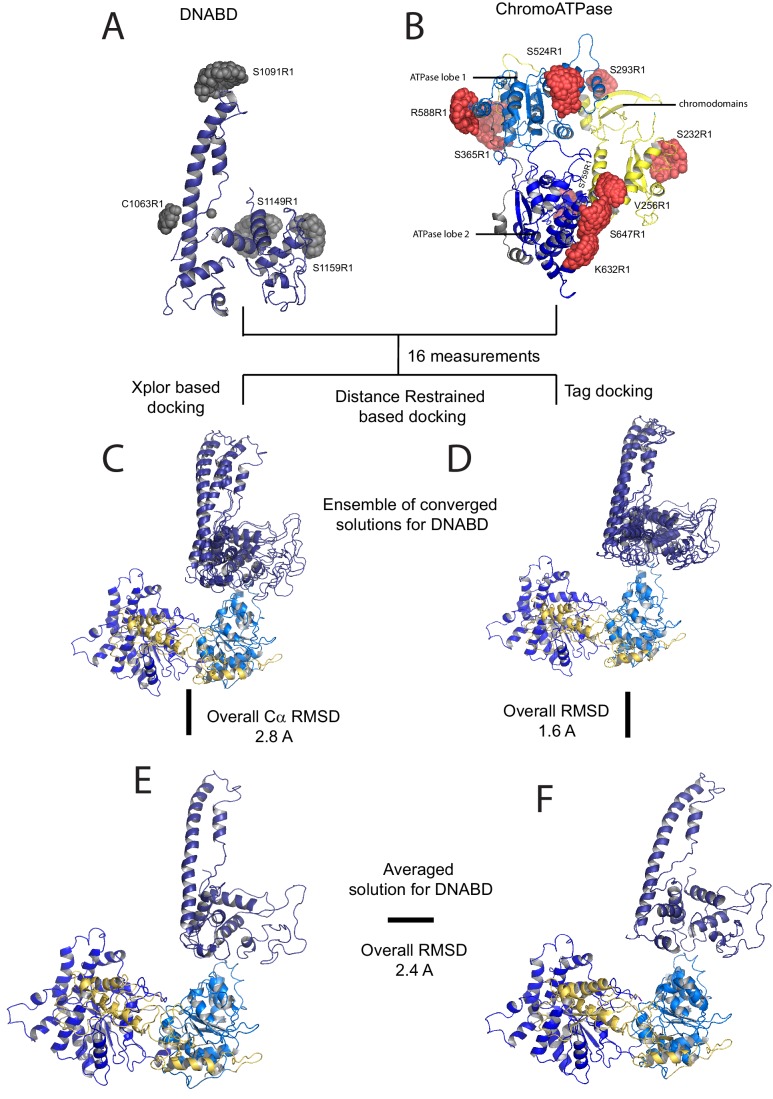
Figure 2. A model for the solution structure of Chd1 based on pulsed EPR measurements.

(A) Structure of DNA-binding domain and (B) chromoATPase domains of Chd1 shown in cartoon representation. The ensemble nitroxide atom distributions correspond to different molecular dynamics simulated conformers of the MTSSL spin label and shown as grey spheres on the DNA-binding domain and as red spheres on the chromoATPase domains. Chromo domain in yellow, ATPase lobe1 in marine, ATPase lobe 2 in blue and the linker region NegC in grey. (C) Converged solutions of the DNA-binding domain orientation relative to the chromo helicase domain determined by rigid body docking using sparse PELDOR data as distance restraints in Xplor-methods. The overall Cα RMSD of the converged structures is indicated. (D) An alternative approach using the Tagdocking method was amended for rigid body docking of the DNA-binding domain on to the chromo helicase. The Cα RMSD of the converged structures is indicated. (E,F) Final averaged structure and the relative Cα RMSD between the structure obtained with two methods are shown in cartoon representation.

DOI: http://dx.doi.org/10.7554/eLife.22510.005

Figure 2.

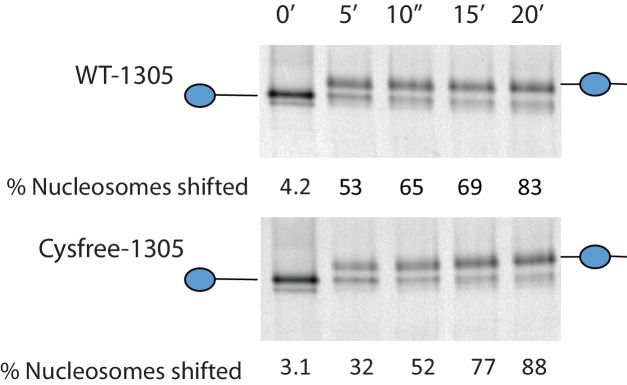
Figure 2—figure supplement 1. Activity of Chd1 following removal of native cysteines.

Figure 2—figure supplement 1.

Nucleosomes assembled onto the fragment 0W47 labelled with cy3 were used as a substrate for repositioning assays using Chd1 1–1305 (top panel) or Chd1 1–1305 with the six native cysteins mutated to serines. Both proteins cause a time-dependent increase in the mobility of nucleosomes in the presence of ATP that is consistent with repositioning to a more central locations. Quantification of the proportion of nucleosomes repositioned indicates that the activities of the two proteins are comparable.
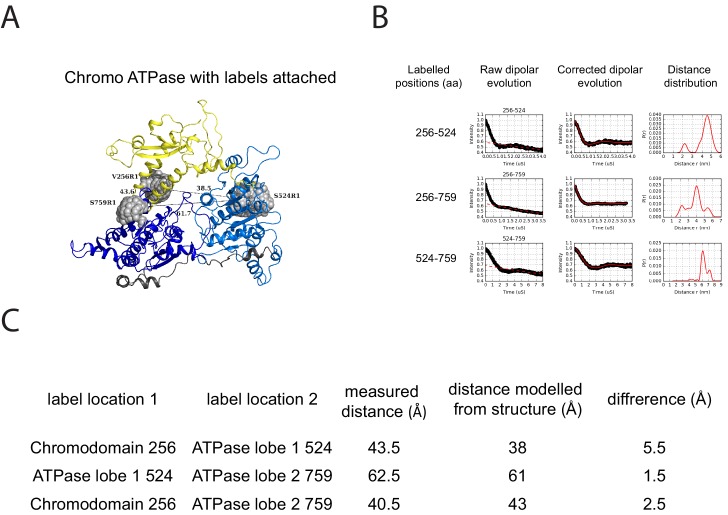
Figure 2—figure supplement 2. PELDOR measurements within the chromoATPase domains of Chd1.

Figure 2—figure supplement 2.

(A) Cartoon representation of the chromo helicase domain with molecular dynamics simulated conformers of MTSSL spin label nitroxide atom drawn as spheres. (B) PELDOR time traces performed between these labelling sites. (C) The measured distance determined experimentally is compared with the distance anticipated based upon modelling to the crystal structure of the chromoATPase domains and the difference between these measurements is shown.
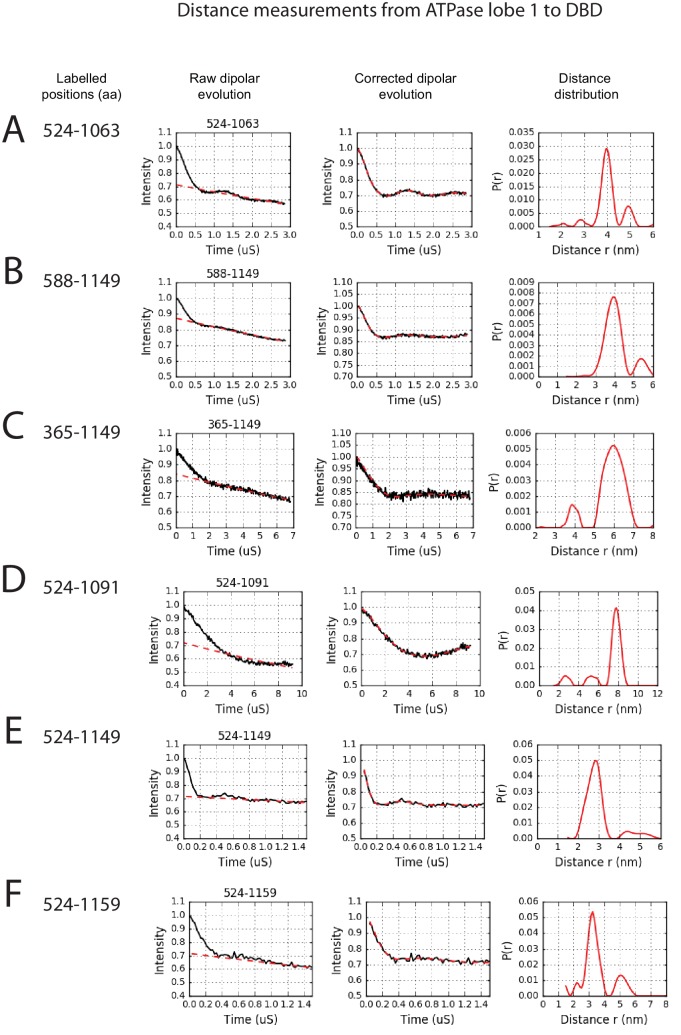
Figure 2—figure supplement 3. PELDOR measurements between ATPase lobe1 and the DNA-binding domain.

Figure 2—figure supplement 3.

PELDOR data for pairs of spin labels attached to the indicated sites on ATPase lobe 1 and the DNA-binding domain of Chd1 (1-1305). Raw dipolar evolution, background corrected evolution and distance distribution obtained after Tikhonov regularisation are shown for the indicated sites.
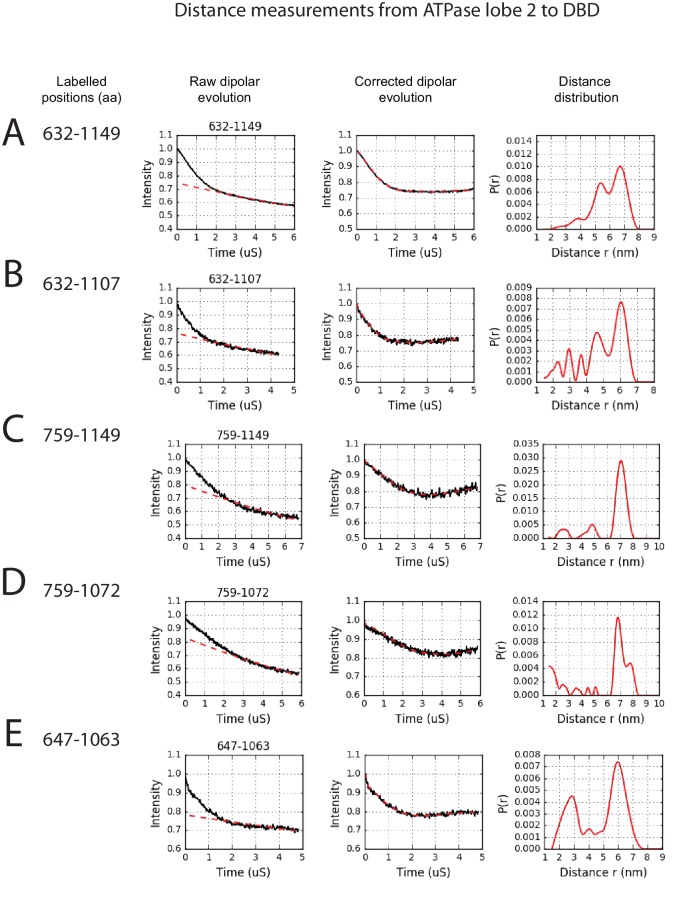
Figure 2—figure supplement 4. PELDOR measurements between ATPase lobe 2 and the DNA-binding domain.

Figure 2—figure supplement 4.

PELDOR data for pairs of spin labels attached to ATPase lobe 2 and the DNA-binding domain of Chd1 (1-1305). Raw dipolar evolution, background corrected evolution and distance distribution obtained after Tikhonov regularisation are shown for the indicated sites.
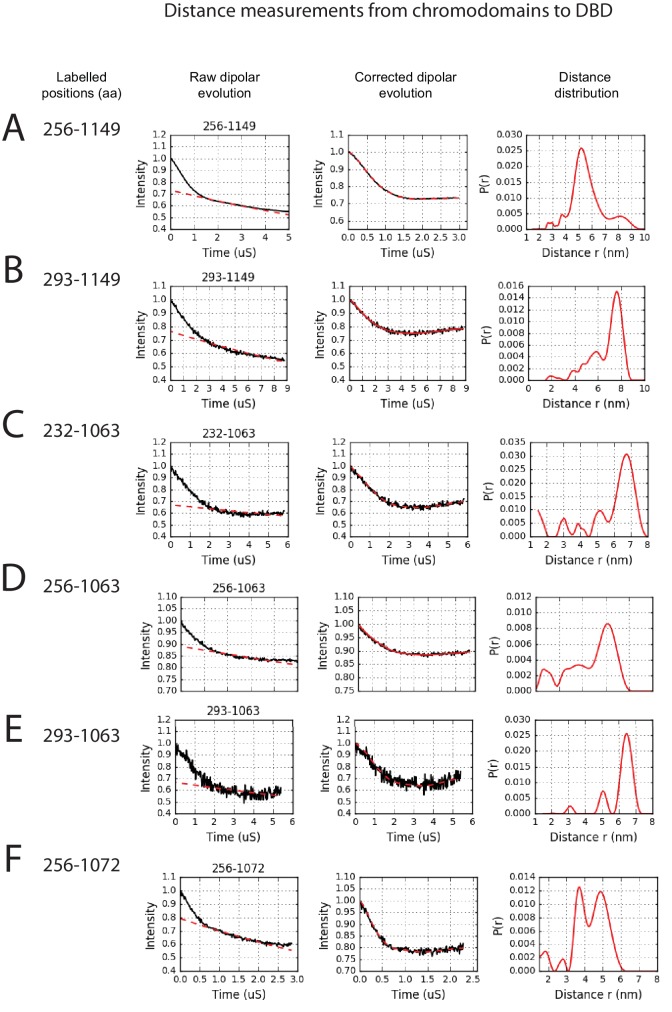
Figure 2—figure supplement 5. PELDOR measurements between chromodomains and the DNA-binding domain.

Figure 2—figure supplement 5.

PELDOR data for pairs of spin labels attached to the chromodomains and sites on the DNA-binding domain of Chd1 (1-1305). Raw dipolar evolution, background corrected evolution and distance distribution obtained after Tikhonov regularisation are shown for the indicated sites.
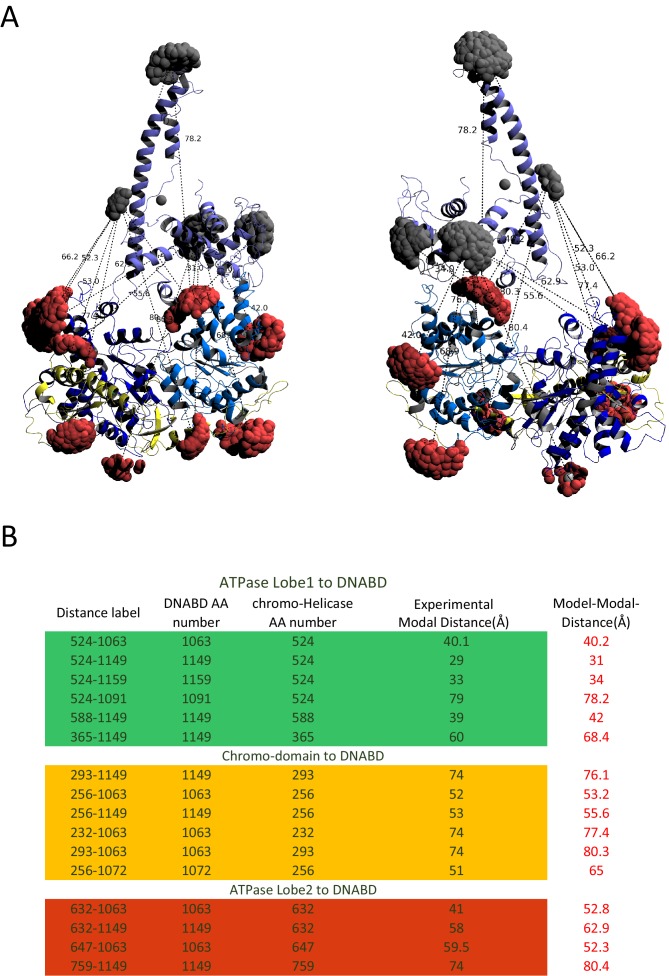
Figure 2—figure supplement 6. Modelled orientation of chromoATPase and DNA-binding domain.

Figure 2—figure supplement 6.

(A) Cartoon representation of the chromo helicase and DNA-binding domain with measured distances indicated. (B) The measured distances determined experimentally are compared with the distances anticipated based on the averaged model obtained in Figure 2E.
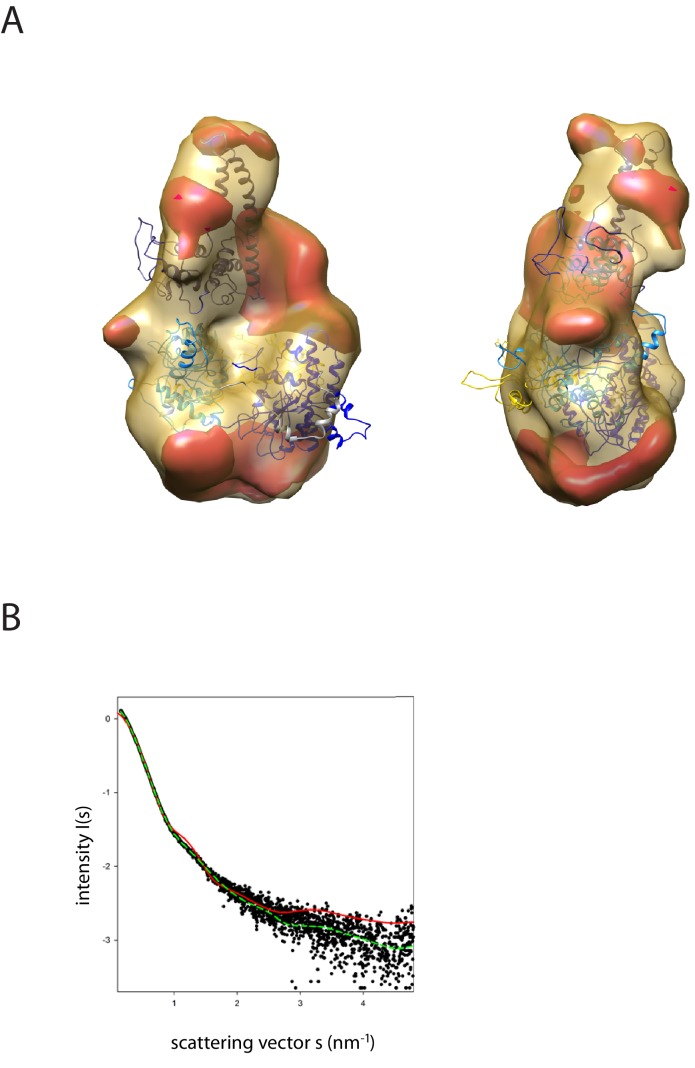
Figure 2—figure supplement 7. Fit of PEDOR model for Chd1 into SAXS volume.

Figure 2—figure supplement 7.

(A) Ab-initio generated SAX volume obtained for Chd1 1-1305 is shown in two orientations. The structure fitted into volume is the model generated from rigid body docking of known crystal structures using sparse PELDOR distance distribution measurements. The difference volume coloured in red-orange indicates the unresolved structures of Chd1 protein (1-175aa in the N-terminal and 932–1010). (B) Comparison of the theoretical scattering curve generated by the alignment of the DNA-binding domain and chromoATPase using the PEDLDOR model (solid red) X2 = 11.5 and following inclusion of N-terminal and linker regions as dummy residues (dashed green) X2 = 2.08 with the experimentally obtained scattering from Chd1 1–1305 (black spots).