. 2017 Mar 23;6:e22510. doi: 10.7554/eLife.22510

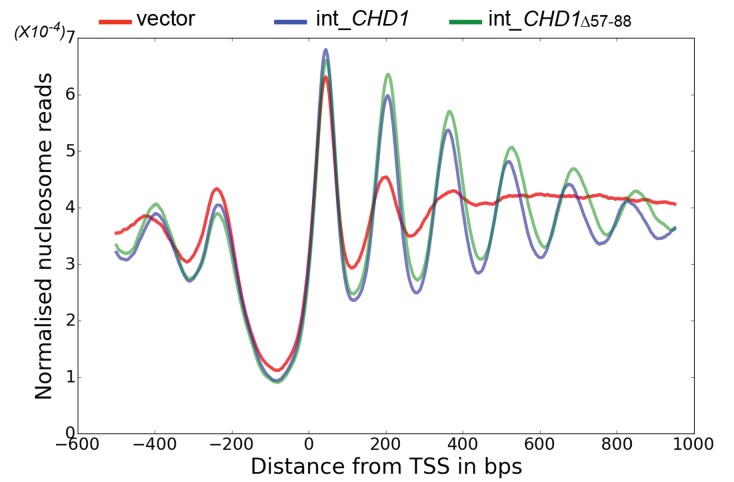
Figure 5. Chd1 △ 57–88 exhibits increased internucleosome spacing in vivo.

MNase-Seq was carried out on a chd1△isw1△ strain transformed with CHD1 and chd1△57-88(integrated at the CHD1 locus) to obtain genome-wide nucleosome occupancy profiles. TSS-aligned nucleosome occupancy profiles are plotted and show restoration of nucleosome organisation with both Chd1 proteins, but with a downstream shift in the locations of nucleosomes organised by the chd1 △57–88 mutant.

DOI: http://dx.doi.org/10.7554/eLife.22510.016

Figure 5.

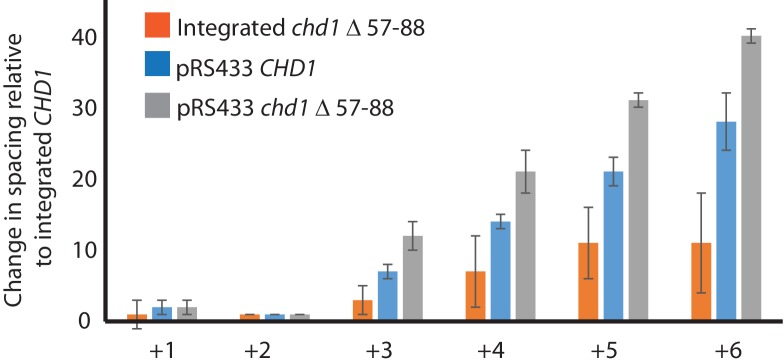
Figure 5—figure supplement 1. Changes in nucleosome positioning following reintroduction of different Chd1 constructs.

Figure 5—figure supplement 1.

Quantitative changes in nucleosome spacing in coding in strains expressing Chd1 (wt/(△57–88) at low (int-integrated) or high (Ectopically expressed from multicopy plasmid pRS423) levels. The shift in nucleosome positions (+1 to +6) in the coding region was calculated relative to integrated-CHD1. The progressive increase in the positioning defect for more distal nucleosomes indicates a difference in average nucleosome spacing. Error bars indicate the standard deviation from three independent repeats.
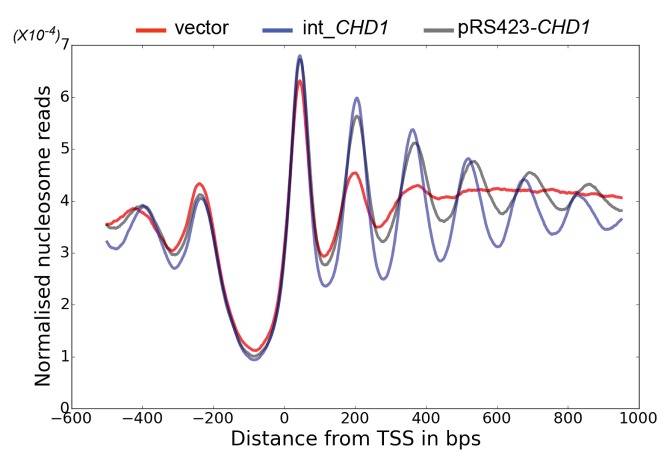
Figure 5—figure supplement 2. Changes in nucleosome positioning following reintroduction of CHD1 at low or high copy number.

Figure 5—figure supplement 2.

Changes in nucleosome spacing in coding regions were measured in isw1△, chd1△ strains transformed with a control vector (vector, red) or in which CHD1 was reintroduced integrated onto the chromosome in single copy (int-CHD1, blue) or at high copy on the multi-copy plasmid pRS423 (pRS423-CHD1, green). TSS-aligned nucleosome occupancy profiles were plotted for the above strains show increased spacing in the strains with higher levels of CHD1.
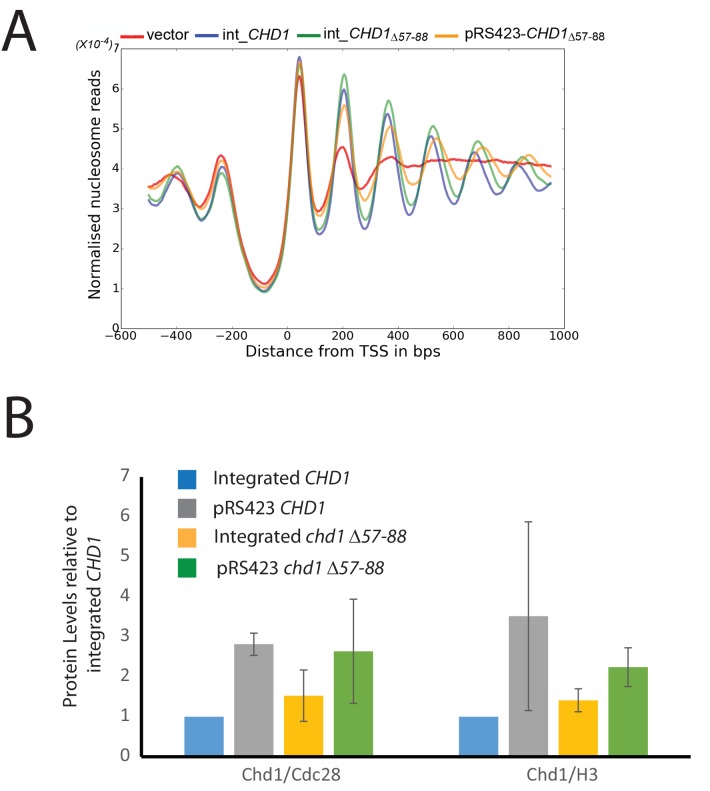
Figure 5—figure supplement 3. Changes in nucleosome positioning following reintroduction of chd1△57–88 at low or high copy number.

Figure 5—figure supplement 3.

(A) Changes in nucleosome spacing in coding regions were measured in strains expressing chd1△57–88 re-integrated in single copy at the CHD1 locus (int_CHD1△57–88, green) or at higher copy number on pRS423 (pRS423_CHD1△57–88, orange). Vector only (red) and CHD1 wt reintroduced integrated onto the chromosome in single copy (int-CHD1, blue) from Figure 5 are also shown for comparison. TSS-aligned nucleosome occupancy profiles show increased spacing in strains with chd1△57–88 compared to wild-type CHD1 (int_ CHD1). Replacement on a high copy plasmid results in two- to fourfold increased Chd1 expression. (B) Quantitative measurement of protein levels in strains expressing CHD1wt or chd1△57–88 at low (int) or high (pRS423) copy number. For all strains described in A, Chd1 was N-terminally flag tagged and anti-FLAG Western blotting used to plot protein levels relative to int-CHD1wt. Quantitation is plotted following normalisation against total histone H3 and Cdc28 as indicated. Error bars indicate standard error from 3–4 measurements.