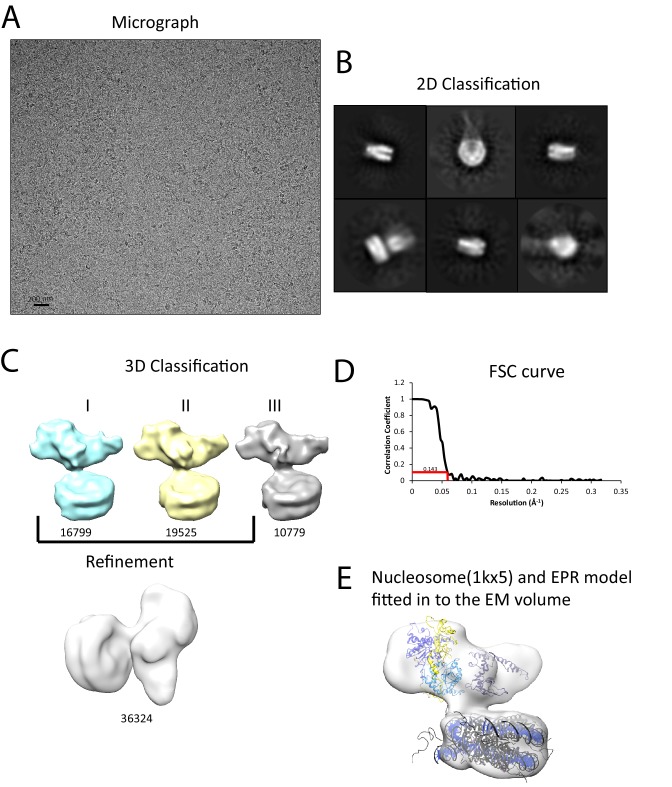
Figure 6. Interaction of Chd1 with nucleosomes in the APO state.
(A) Representative micrograph of frozen hydrated nucleosome-Chd1 apo complex. (B) Two-dimensional class averages of the CTF corrected auto picked particles is shown. (C) Volume maps are drawn for the three classes obtained from the 3D classification of the particles and final refined volume of the set of 3D classified particles from merging two similar 3D classes as indicated. (D) Fourier-Shell correlation after gold-standard refinement and conservative resolution estimate at 0.143 correlation. (E) Electron density map obtained for nucleosome-Chd1 apo complex is shown in semi-transparent surface. The constructed Chd1 solution structure and the nucleosome (1KX5) are docked into the volume.

