. 2017 Mar 23;6:e22510. doi: 10.7554/eLife.22510

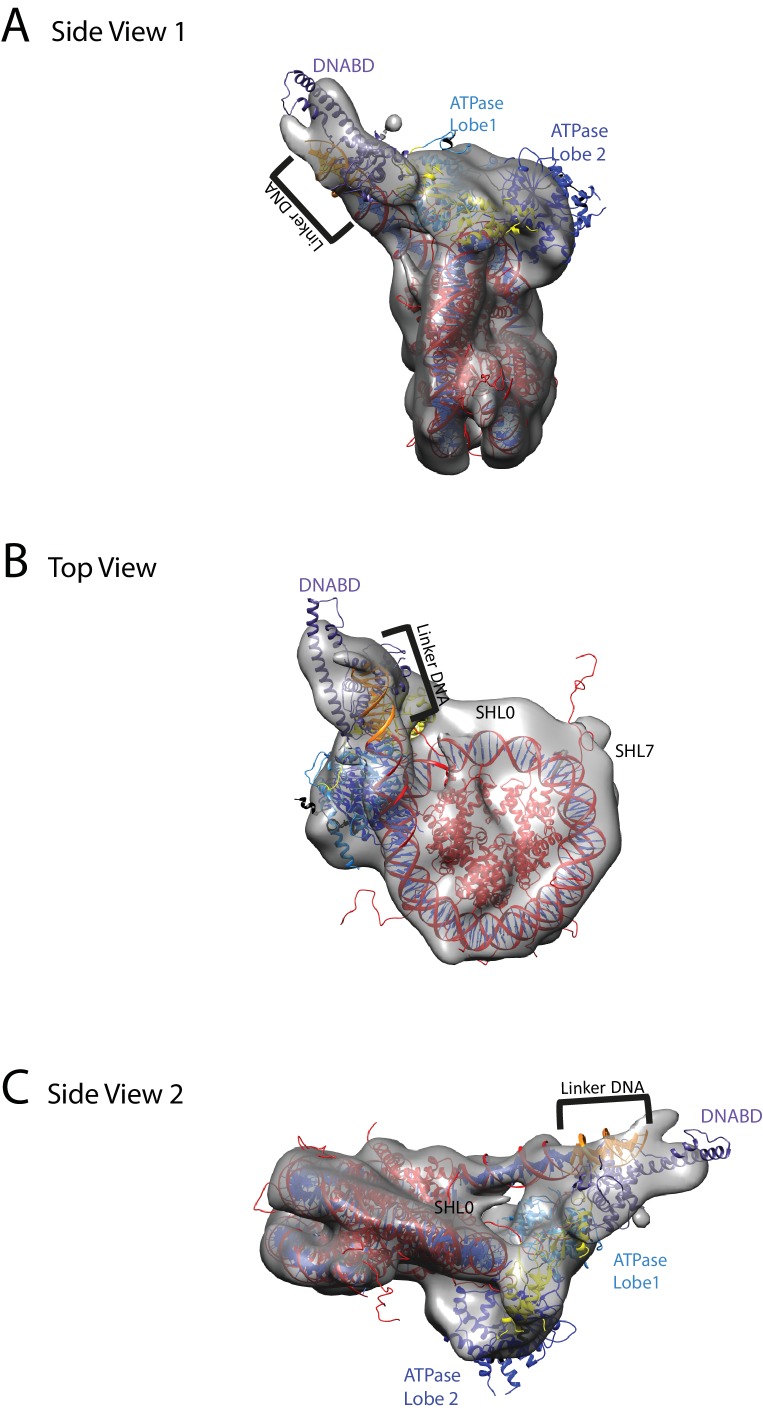
Figure 7. Chd1 bound to nucleosomes via its DNA binding and ATPase domains.

(A) Side view 1 of the electron density map shown in semi-transparent grey surface with docked nucleosome (red, 1KX5) and the Chd1, chromoATPase (3MWY) and DNA-binding domain (3TED) crystal structures shown in cartoon representation. The various domains of Chd1 are labelled. ATPase lobe1 in marine, ATPase lobe2 in blue, chromo domain in yellow and the DNA-binding domain in deep blue. The 11 bp DNA linker region defined in the electron density map is coloured orange and indicated. (B) Top view of the nucleosome-bound Chd1 complex. The dyad axis of the nucleosome is labelled as SHL0 (super helical location 0) and edge of the nucleosome is indicated as SHL7. (C) Side view 2 of the nucleosome-Chd1 complex.

DOI: http://dx.doi.org/10.7554/eLife.22510.021

Figure 7.

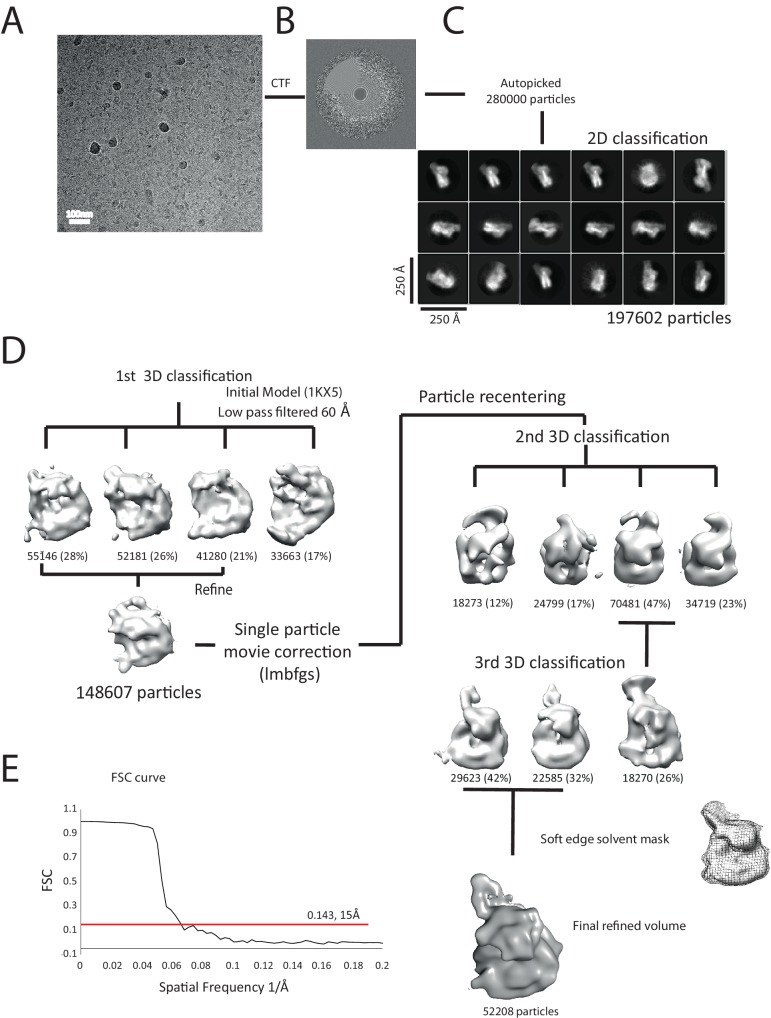
Figure 7—figure supplement 1. Overview of the cryoEM-data.

Figure 7—figure supplement 1.

(A) Representative micrograph of frozen hydrated nucleosome-Chd1 complex. (B) The CTFFIND4 output generated from the micrograph shown in (A). The experimentally observed Thon rings align with the predicted Thon rings (shown as a quadrant). (C) Two-dimensional class averages of the CTF corrected auto picked particles is shown. Many of the classes have a visible attachment adjacent to the nucleosome. (D) Workflow of the three-dimensional classification and structure refinement. In the first 3D classification, the crystal structure of the nucleosome (1KX5) was converted to a low-pass filtered volume map and used as reference map. The particle numbers in each class are indicated. For the single particle movie correction, lmbfgs (Limited Memory Broyden–Fletcher–Goldfarb–Shanno) algorithm was used. The two major classes from the third 3D classification were subject to refinement following application of a solvent mask applied using Relion 1.4. The final refined volume has 52208 particles and estimated resolution of 15 Å. (E) Gold standard Fourier-Shell correlation and resolution using the 0.143 criterion.
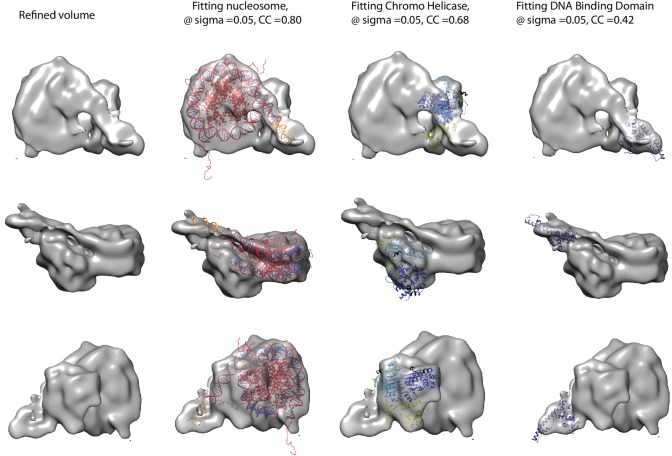
Figure 7—figure supplement 2. Fitting of nucleosome and Chd1 crystal structures into cryoEM map.

Figure 7—figure supplement 2.

Three views of the final refined electron density map of the nucleosome-Chd1 complex and the docked crystal structures of nucleosome (1KX5) with the extended linker DNA, chromo-helicase (3MWY) and the DNA-binding domain are shown. The correlation coefficient calculated for the rigid body fit @ 0.05 sigma level is indicated.
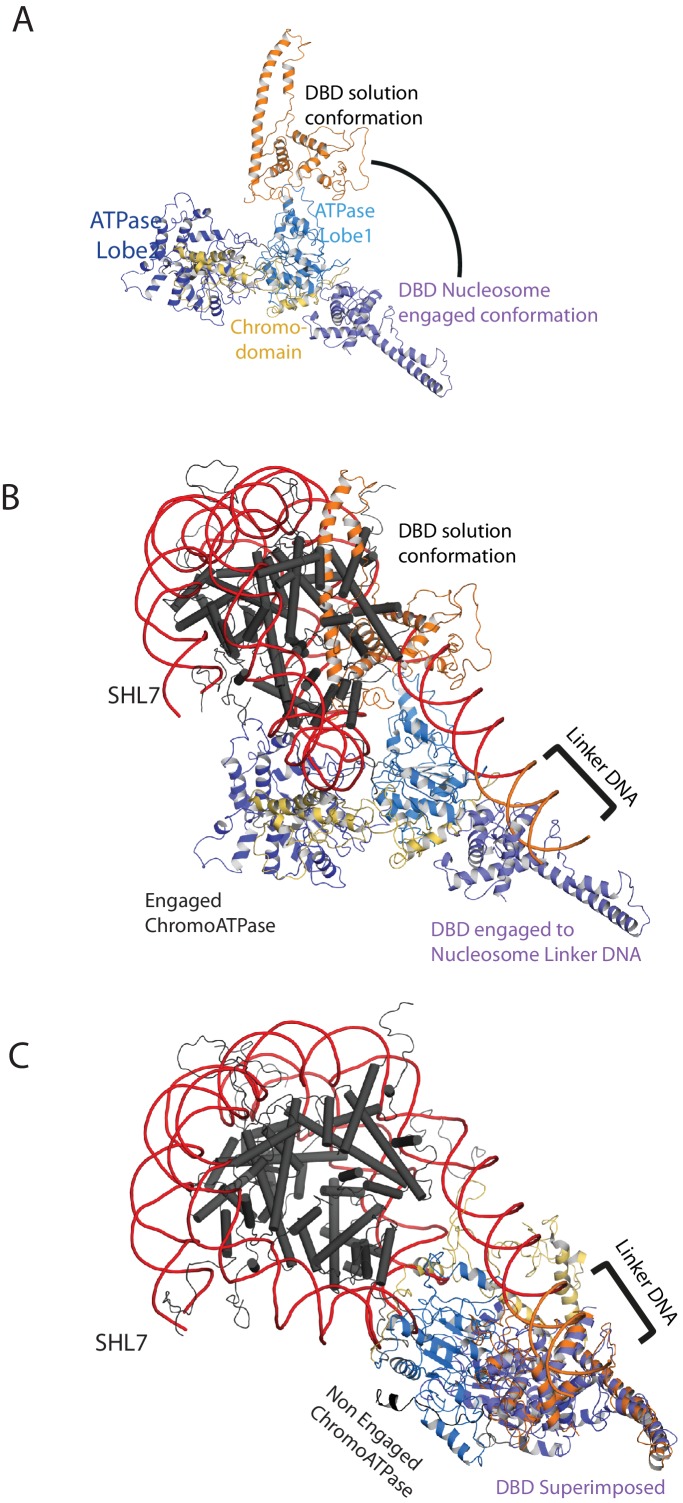
Figure 7—figure supplement 3. Comparison of DNA-binding domain orientation in solution structure and when engaged with nucleosomes.

Figure 7—figure supplement 3.

(A) Solution of the structural model for Chd1 in solution derived from Figure 2 is superimposed on to Chd1 in the conformation observed when it is engaged with nucleosomes. The DBD domain from the solution model is coloured in orange and the nucleosome-bound state in deep blue. (B) The solution model for Chd1 is docked onto a nucleosome using the location of the ATPase domains within the engaged state as a reference point. This conformation is not feasible as there are major clashes with the histone octamer. (C) The solution model for Chd1 is docked onto a nucleosome using the location of DBD in the nucleosome-engaged state as a reference point. This conformation is related to that observed for Chd1 in the apo state (Figure 6).
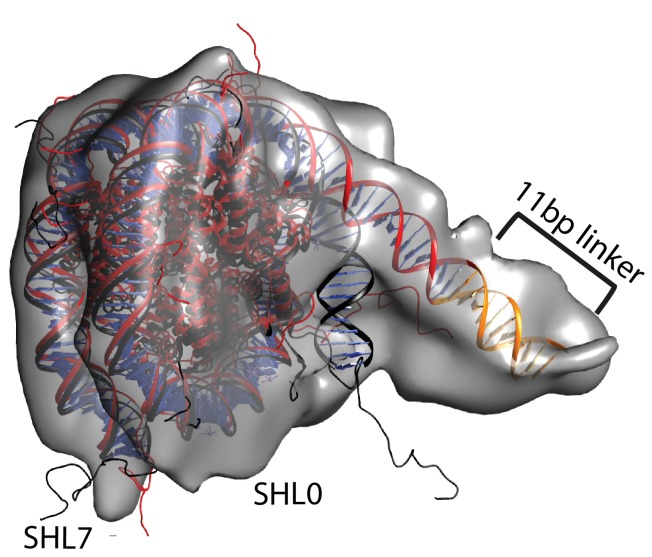
Figure 7—figure supplement 4. Unravelling of nucleosomal DNA adjacent to the bound linker.

Figure 7—figure supplement 4.

Refined cryoEM map of nucleosome-Chd1 complex is shown in semi-transparent with docked nucleosome (1KX5) crystal structure. The extended 11 bp linker DNA on one side of the nucleosome as defined in the electron density map is coloured in orange. The modelled nucleosome in the cryoEM map (red) is compared with the nucleosome crystal structure (Black). The outer turn of a fully wrapped nucleosome protrudes out of the envelope supporting unwrapping to accommodate the altered trajectory. The nucleosome dyad axis is marked as SHL0 and the linker free side of the nucleosome is marked as SHL7.