. 2017 Mar 23;6:e22510. doi: 10.7554/eLife.22510

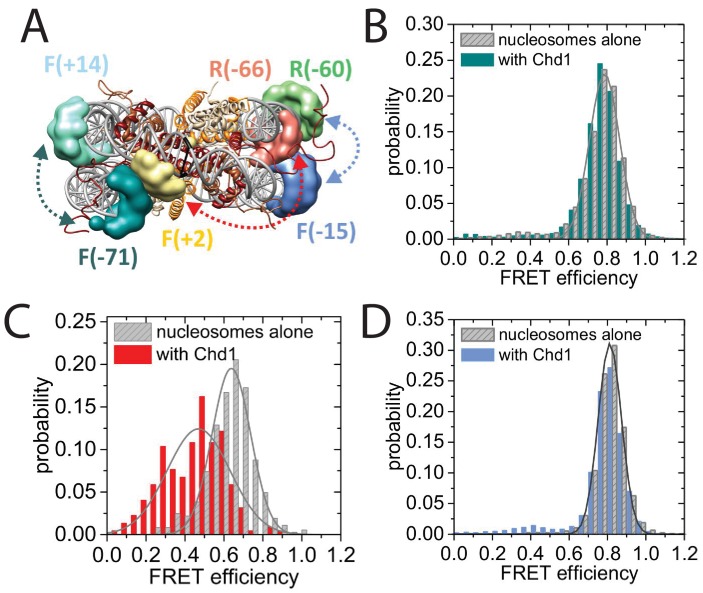
Figure 8. Nucleotide binding affects DNA wrapping in Chd1-nucleosome complexes.

Experiments were performed using nucleosomes with dye labels attached to two specific positions alone and in presence of Chd1 1–1305. (A) Schematic illustration of the dye positions for the smFRET measurements. (B–D) Histograms of measured smFRET efficiencies for nucleosomes alone (grey) and in presence of Chd1 1–1305 and 150 µM AMP-PNP (colored) for dyes attached to positions F-71 - Alexa647 and to F + 14 - Tamara (B, dark cyan). In this case 2072 complexes without and 1922 complexes with Chd1 were assessed. For dyes at positions F + 2 Tamra and to R-66 - Alexa647 (C, red) 365 complexes were studied without Chd1 and 222 with. With dyes at F-15 - Tamara and to R-60-Alexa647 (D, light blue) 306 complexes were studied without Chd1 and 292 molecules with.

DOI: http://dx.doi.org/10.7554/eLife.22510.026

Figure 8.

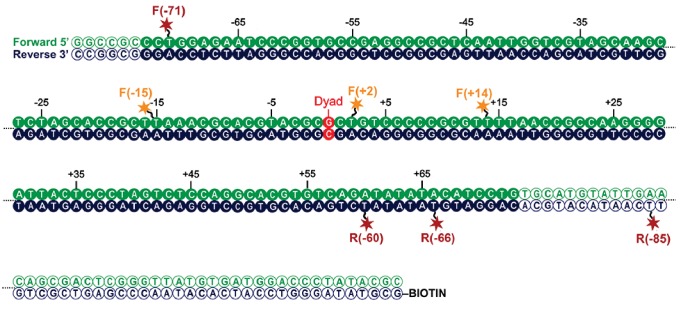
Figure 8—figure supplement 1. Map indicating locations to which fluorescent dyes are attached.

Figure 8—figure supplement 1.

Schematic illustration of the nucleosomal DNA and designed label positions, depicted as stars (red, acceptor dye Alexa647; yellow, donor dye Tamra). Nucleotides marked as open circles constitute the linker DNA, whereas nucleotides shown as filled circles are part of the 601 sequence and therefore constitute DNA inside the nucleosome core.
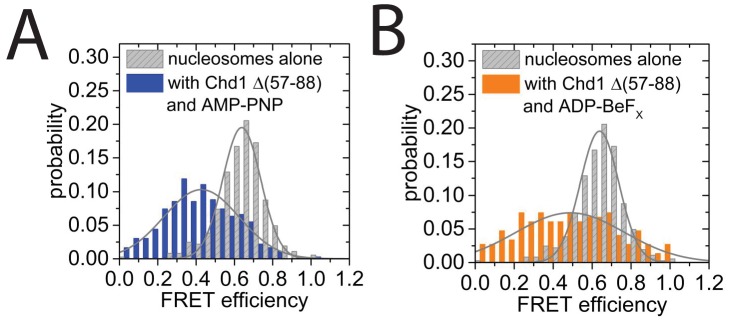
Figure 8—figure supplement 2. smFRET analysis of DNA unwrapping with Chd1 △57–88 and in the presence of ADP-BeFx.

Figure 8—figure supplement 2.

(A) FRET efficiency histogram for nucleosomes labelled with dyes at positions F + 2 Tamra and to R-66 in the absence (grey - 365 nucleosomes) and presence of Chd1 △57–88 (blue – 363 complexes) in the presence of AMP-PNP. Similar DNA unwrapping is observed when compared to Chd1 1–1305 (Figure 8C). (B) A FRET change is also observed at this location in the presence of ADP-BeFx (orange – 148 complexes).
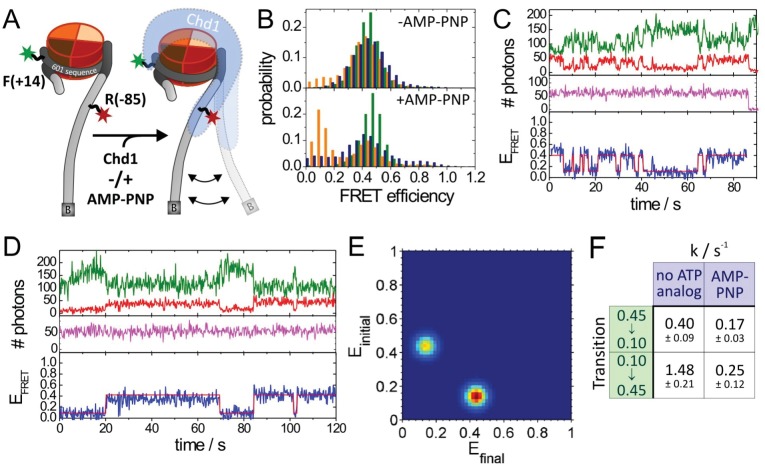
Figure 8—figure supplement 3. Quantitative smFRET analysis of DNA linker dynamics introduced by Chd1 binding.

Figure 8—figure supplement 3.

(A) Cartoon illustrating the smFRET measurement of nucleosomes labelled at position R-85 with Alexa647 and at position F + 14 with Tamra. Observed dynamics of the linker DNA (see panel C–F) in the presence of Chd1 (shaded blue shape) are indicated. (B) FRET efficiency histograms of nucleosomes alone (green), nucleosomes in the presence of 50 nM Chd1 showing static FRET (blue) as well as dynamic FRET trajectories (orange). The upper panel shows data of the measurements without ATP analog (Green:720 molecules, blue:779 molecules, orange 184 molecules) and the lower panel shows data of the measurements with 150 µM AMP-PNP PNP (green: 1415 molecules, blue: 624 molecules, orange: 188 molecules). (C) Typical dynamic FRET time trace in the presence of Chd1 without AMP-PNP. Time trace of donor fluorescence (green, upper panel) and acceptor fluorescence upon green excitation (red, upper panel) are shown together with the acceptor fluorescence upon direct excitation at 637 nm (magenta, middle panel). In the lower panel, the computed FRET efficiency (blue) is presented together with the time-dependent transitioning between different FRET states as identified by HMM analysis (red). (D) Example of a dynamic FRET time trace in the presence of Chd1 and AMP-PNP. Same colour coding as in panel (C). (E) Transition density plot (TDP) for transitions resulting from HMM analysis of a total of 188 dynamic traces of nucleosomes in the presence of Chd1 alone showing 189 transitions. (F) Table presenting transition rates and their standard deviations in extracted from a mono-exponential fit to the cumulative distribution of dwell times of each transition.